2009 FMS gains as a function of pseudorapidity
Here is a summary of the results of looking at the 2009 FMS gains as a function of pseudorapidity.
The pseudorapidity calculated for the centre of each small FMS cell is shown in figure 1:
.png)
Figure 1: η of the centre of small FMS cells.
Using 2009 gain data (a spreadsheet of which is attached as fmsGains.xls we plotted the measured gain of each small cell vs. the pseudorapidity of the physical centre of the cell.
Figure 2 shows the measured 2009 gain vs. the cell η:

Figure 2: 2009 gain a function of cell η.
Selecting gains in the range 0.001 < gain < 0.07 to reject zeros and outliers (indicated by the red lines in figure 2) and forming the projection, the mean gain as a function of η is a shown in figure 3:

Figure 3: Mean gain as function of η
Figure 3 shows that the gain reaches an approximate plateau for η > 3.6.
Plotting gain/sinθ we find a linear trend in the gain profile:
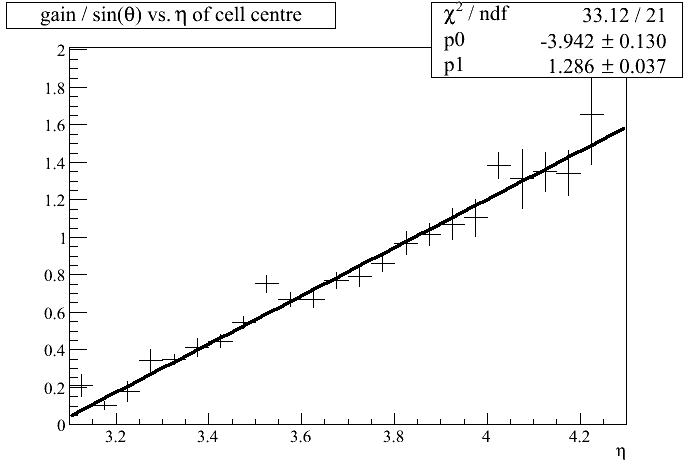
Figure 4: gain/sinθ vs. η = -ln(tan(θ/2))
- tpb's blog
- Login or register to post comments