Lambda spin-spin correlations paper proposal - supplemetary materials
Updated on Tue, 2025-05-20 09:03. Originally created by vanekjan on 2024-07-26 13:34.
Page containing supporting materials for the paper proposal.
Supplemental materials:
The text with latest supplemental materials is available here.
Previous versions: v1, v2, v3, v4, v5, v6, v7, v8
Supporting figures:

Figure 1: 2D invariant mass of pi-p pairs, paired with pi+pbar pairs. The true L-Lbar pairs are visible as the main peak in the middle of the plot. The two ridges then correspond to a real L or Lbar matched with combinatorial background. The main peak and both ridges are on top of a continuum background that originates from background pi-p pairs paired with background pi+pbar pairs.

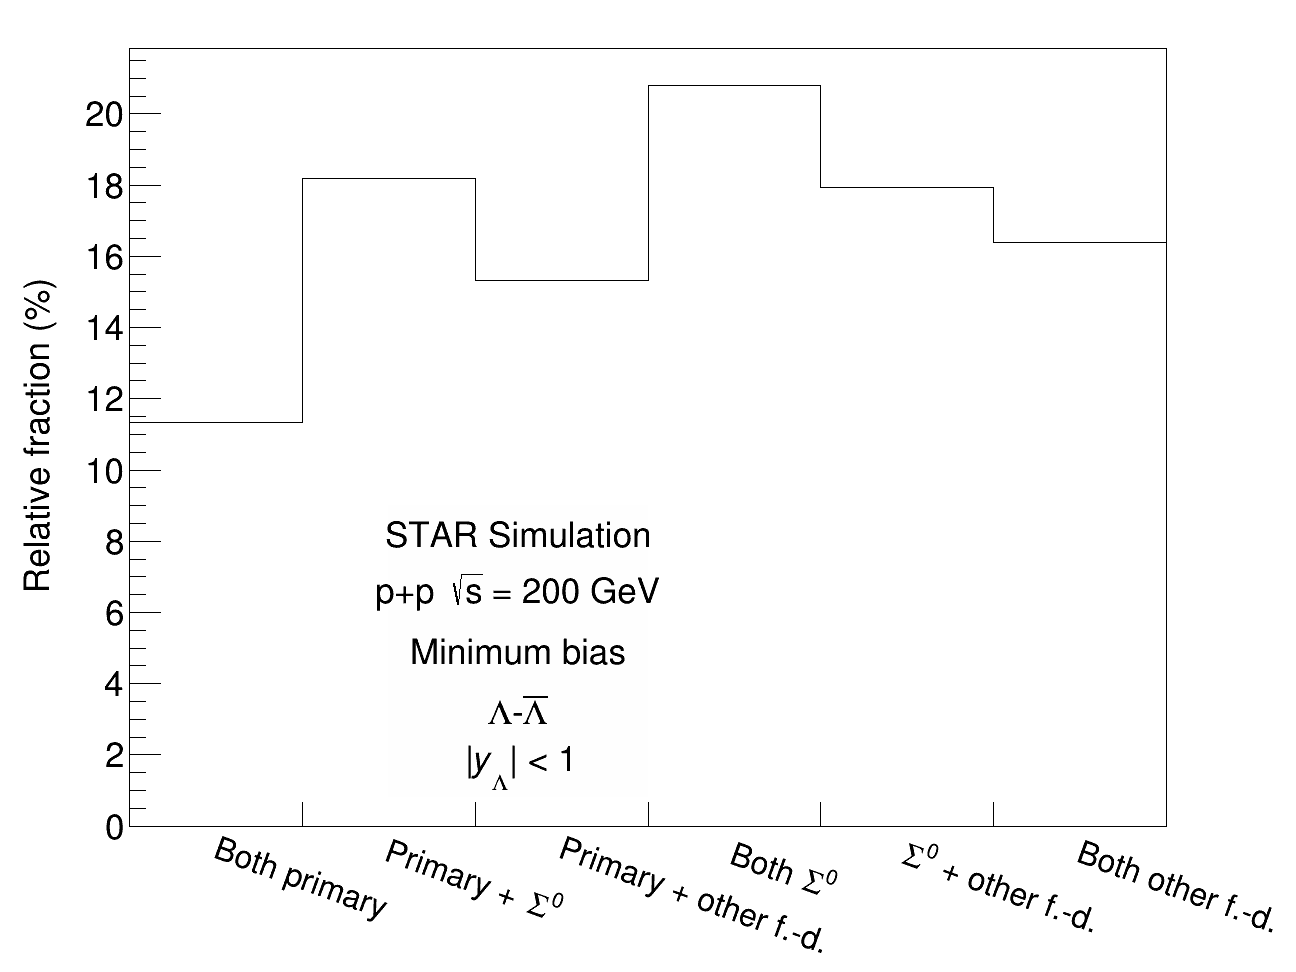
Figure 2: L-Lbar hyperon pair feed-down composition from PYTHIA 8 event generator events, which are simulated through the STAR detector.
»
- vanekjan's blog
- Login or register to post comments
