run12 pp200 region UE plots QA
Updated on Mon, 2016-06-20 01:06. Originally created by veprbl on 2016-06-01 11:11.
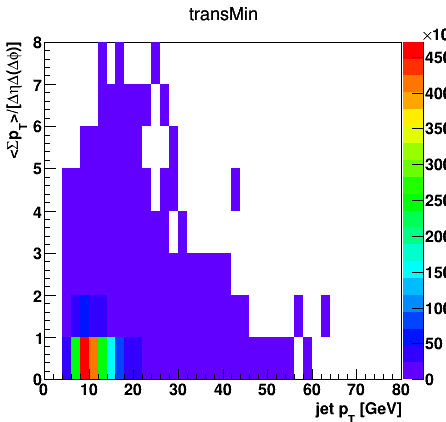
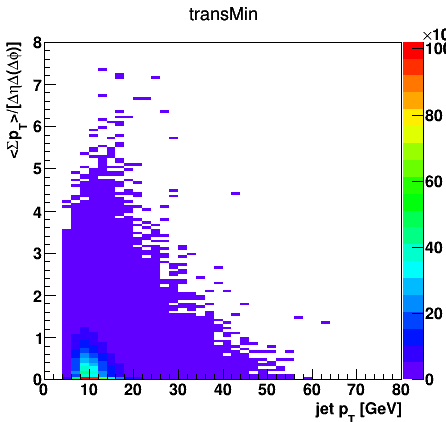
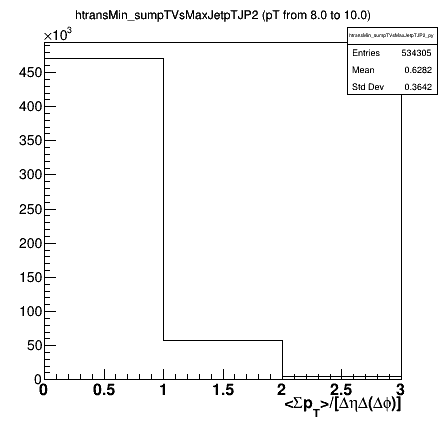
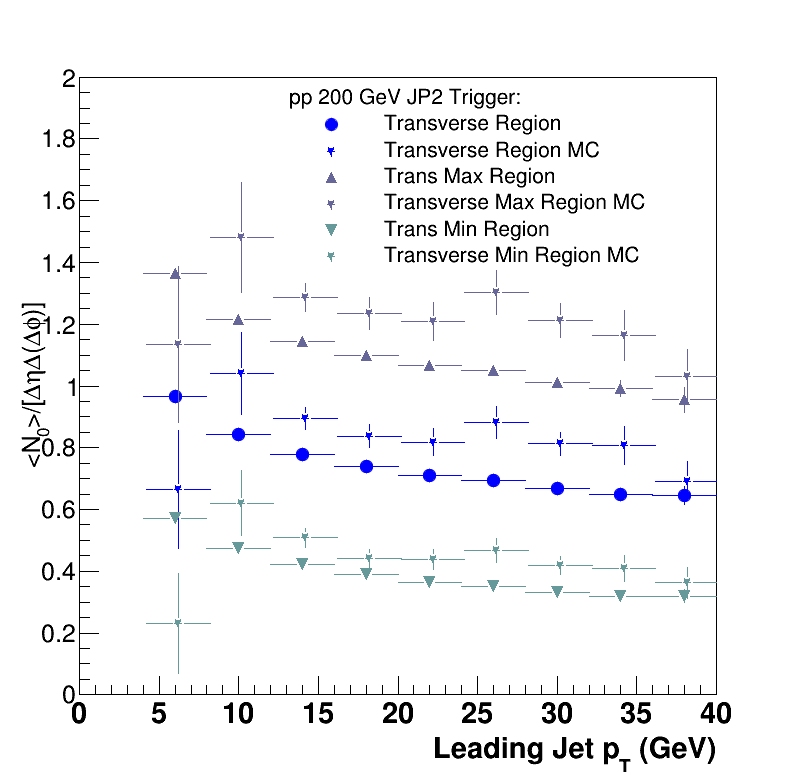
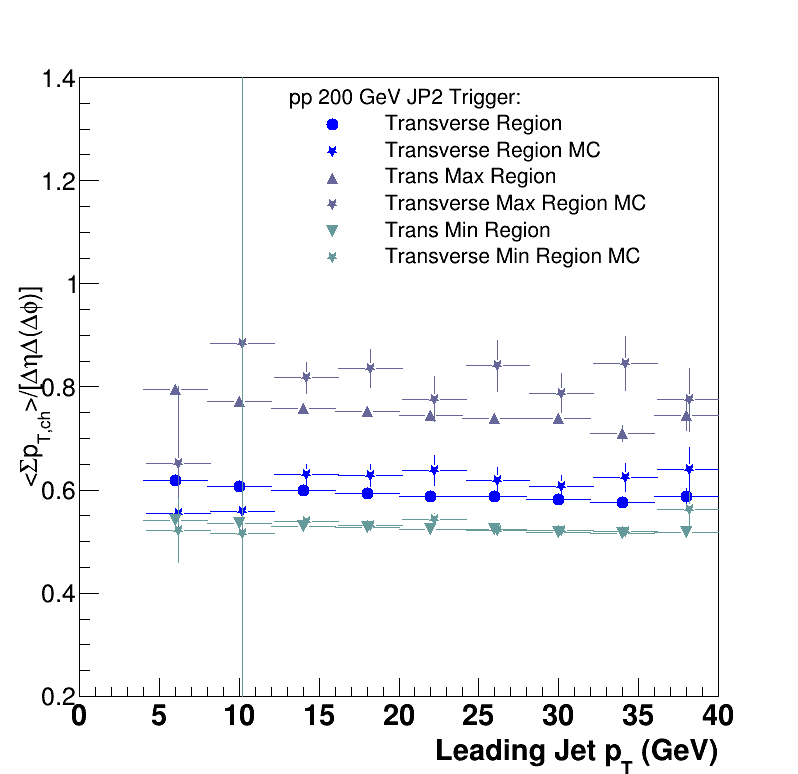
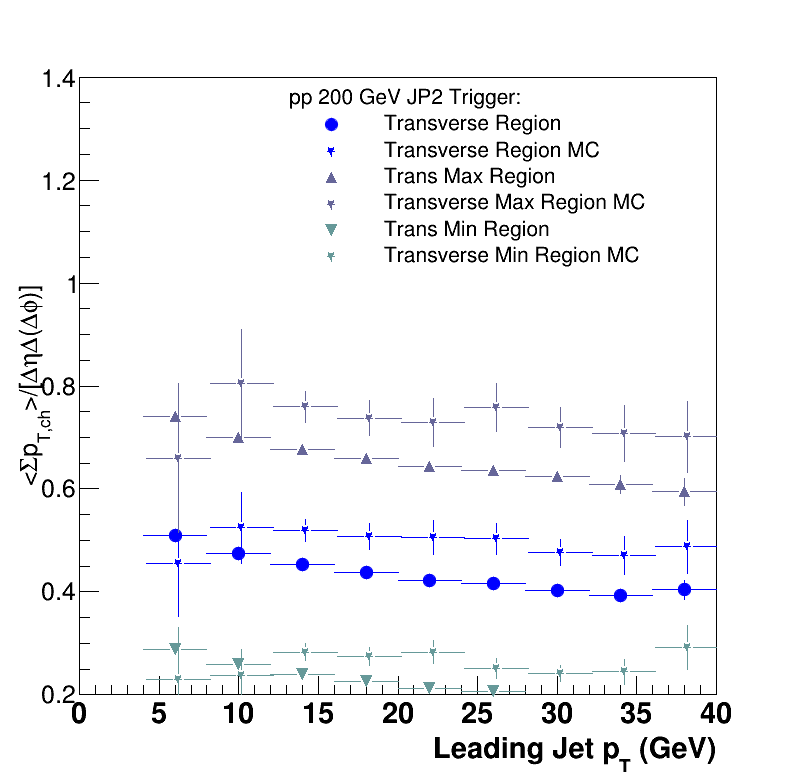
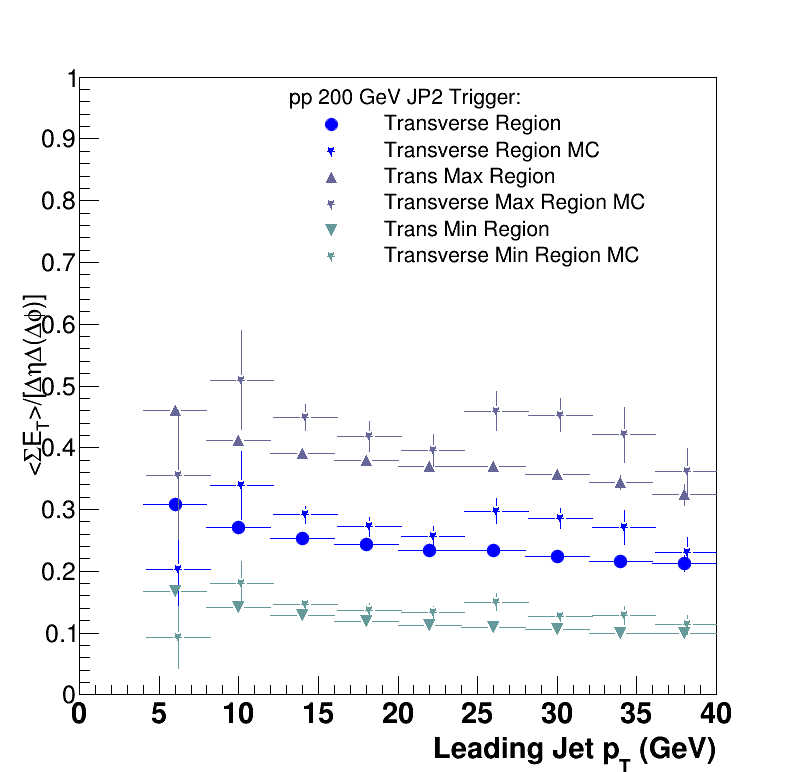
The plots for average values of UE are generated from TH2's using standard ProfileX method. However standard binning in y of the source 2d histograms is too coarse. In the limit of large bins the averages go up as bin_width/2, this well seen on sum(E_t) plot where binning significantly raised minimum average value and lowered spread between transmin, trans and transmax. Problem may have affected run9 plots. The solution is to make bins small as possible. In fact it's the result converges to the best at infinitely small binning. This happens at expense of visuals of the source 2d histograms, but we don't show at them.
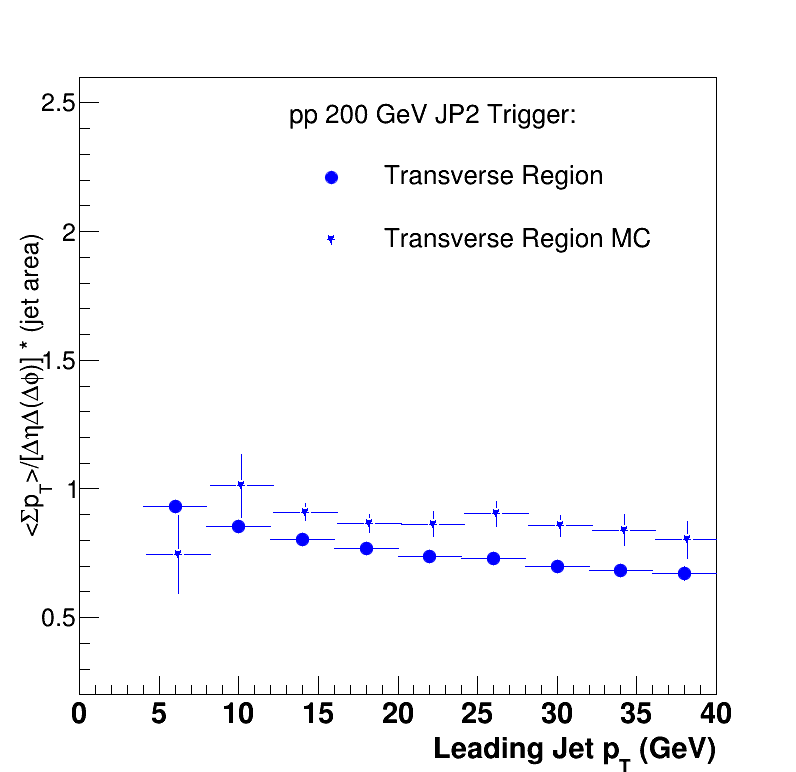
.png)
I will now some of the source 2d histograms and their slices for the purpose of illustration:
| Coarse binning (20,0.,20.) | Fine binning (320,0.,20.) |
 |
 |
 |
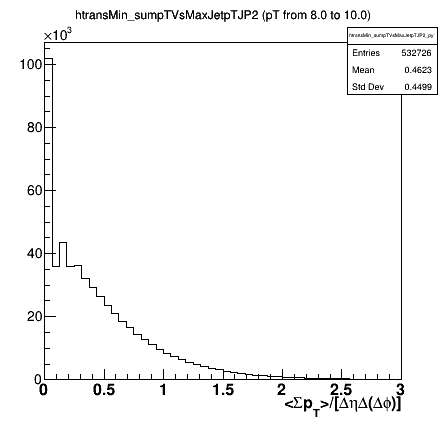 |
There are also variables such as track number for which averages can go up after the increase of the resolution:
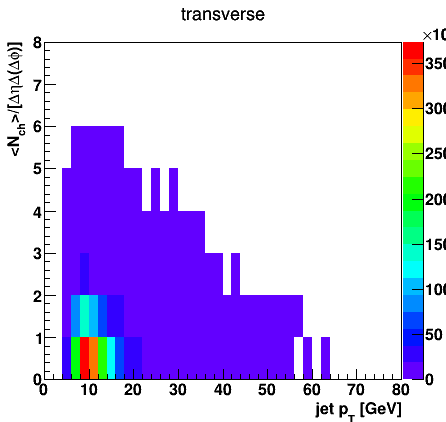 |
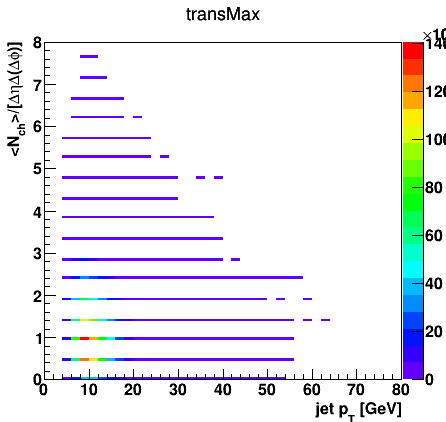 |
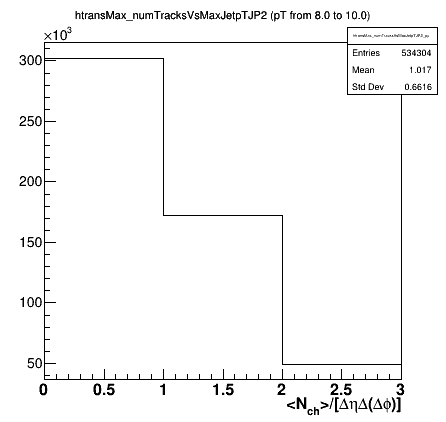 |
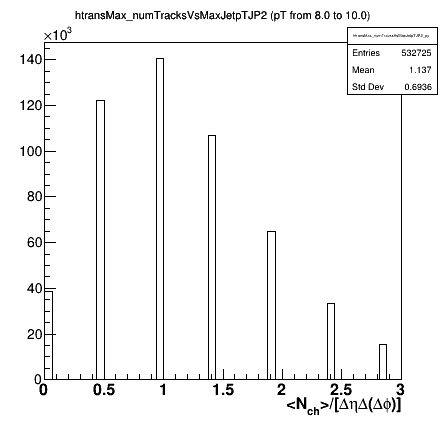 |
Comparison between resulting profiles with original and fine binning:
| Coarse binning (20,0.,20.) | Fine binning (320,0.,20.) |
| Number of tracks | |
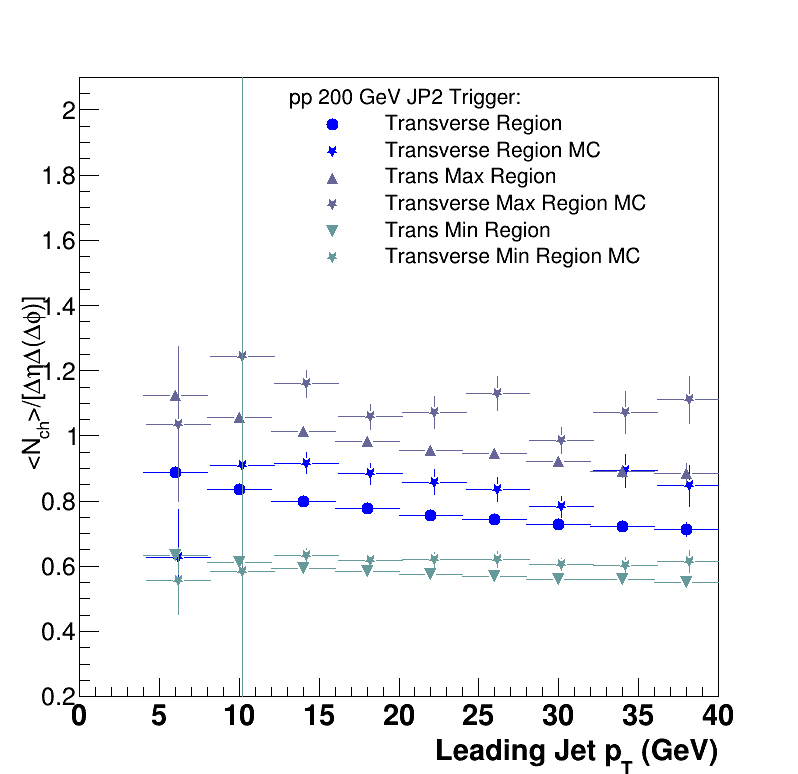 |
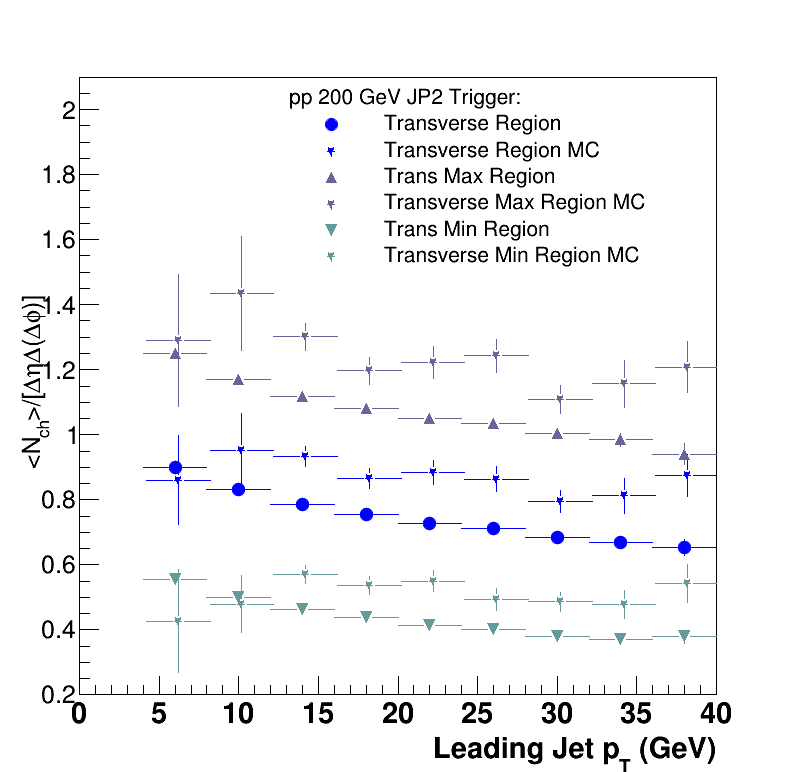 |
| Number of tracks + number of towers | |
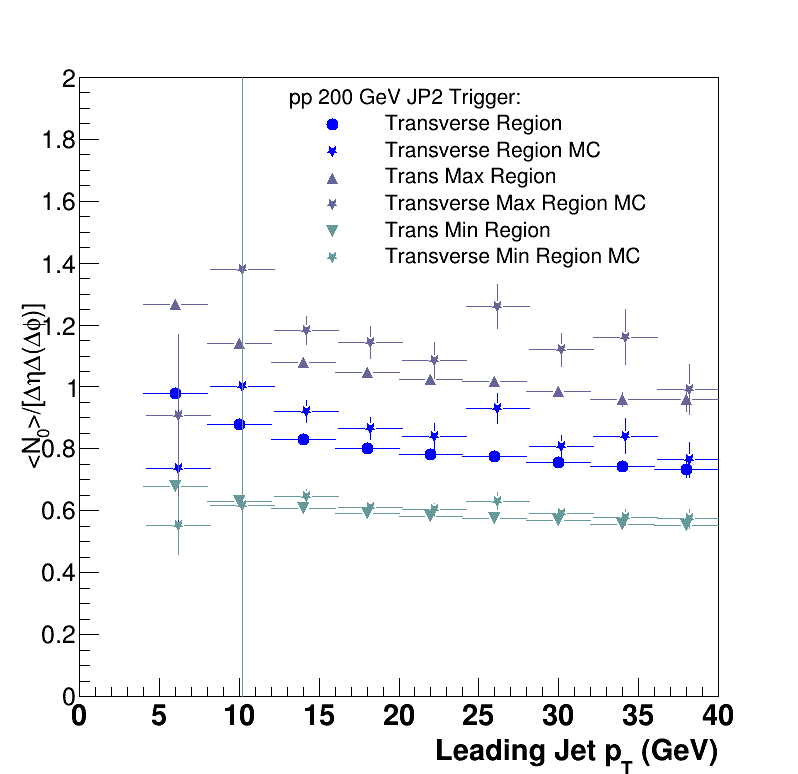 |
 |
| Average track pT | |
 |
 |
| Average tower E_T | |
.png) |
 |
| Average of (track pT + tower E_T) | |
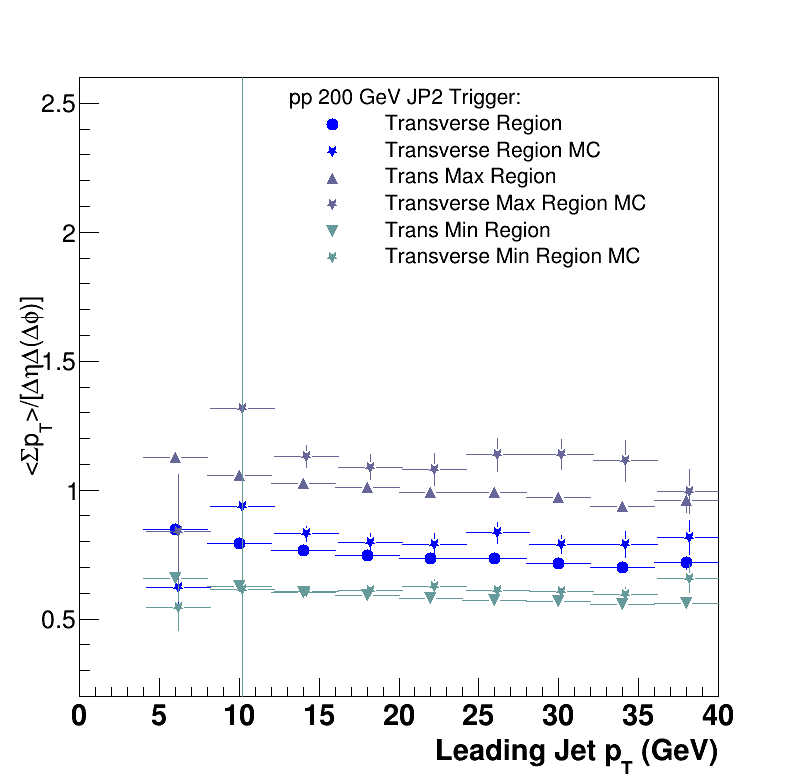 |
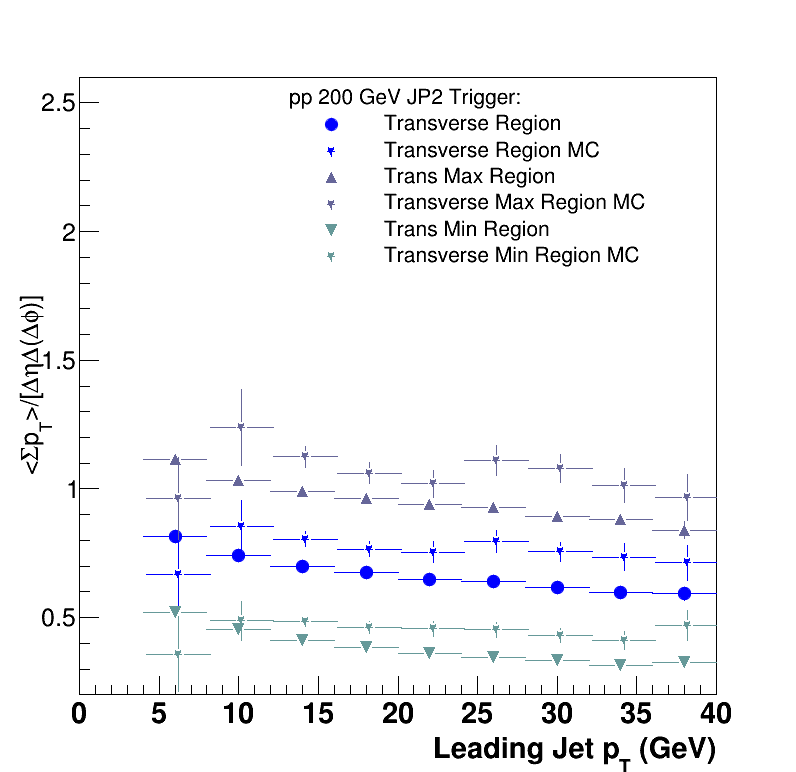 |
Plot for value of the UE correction for the leading jet:

.png)
»
- veprbl's blog
- Login or register to post comments
