Cluster parameter distributions
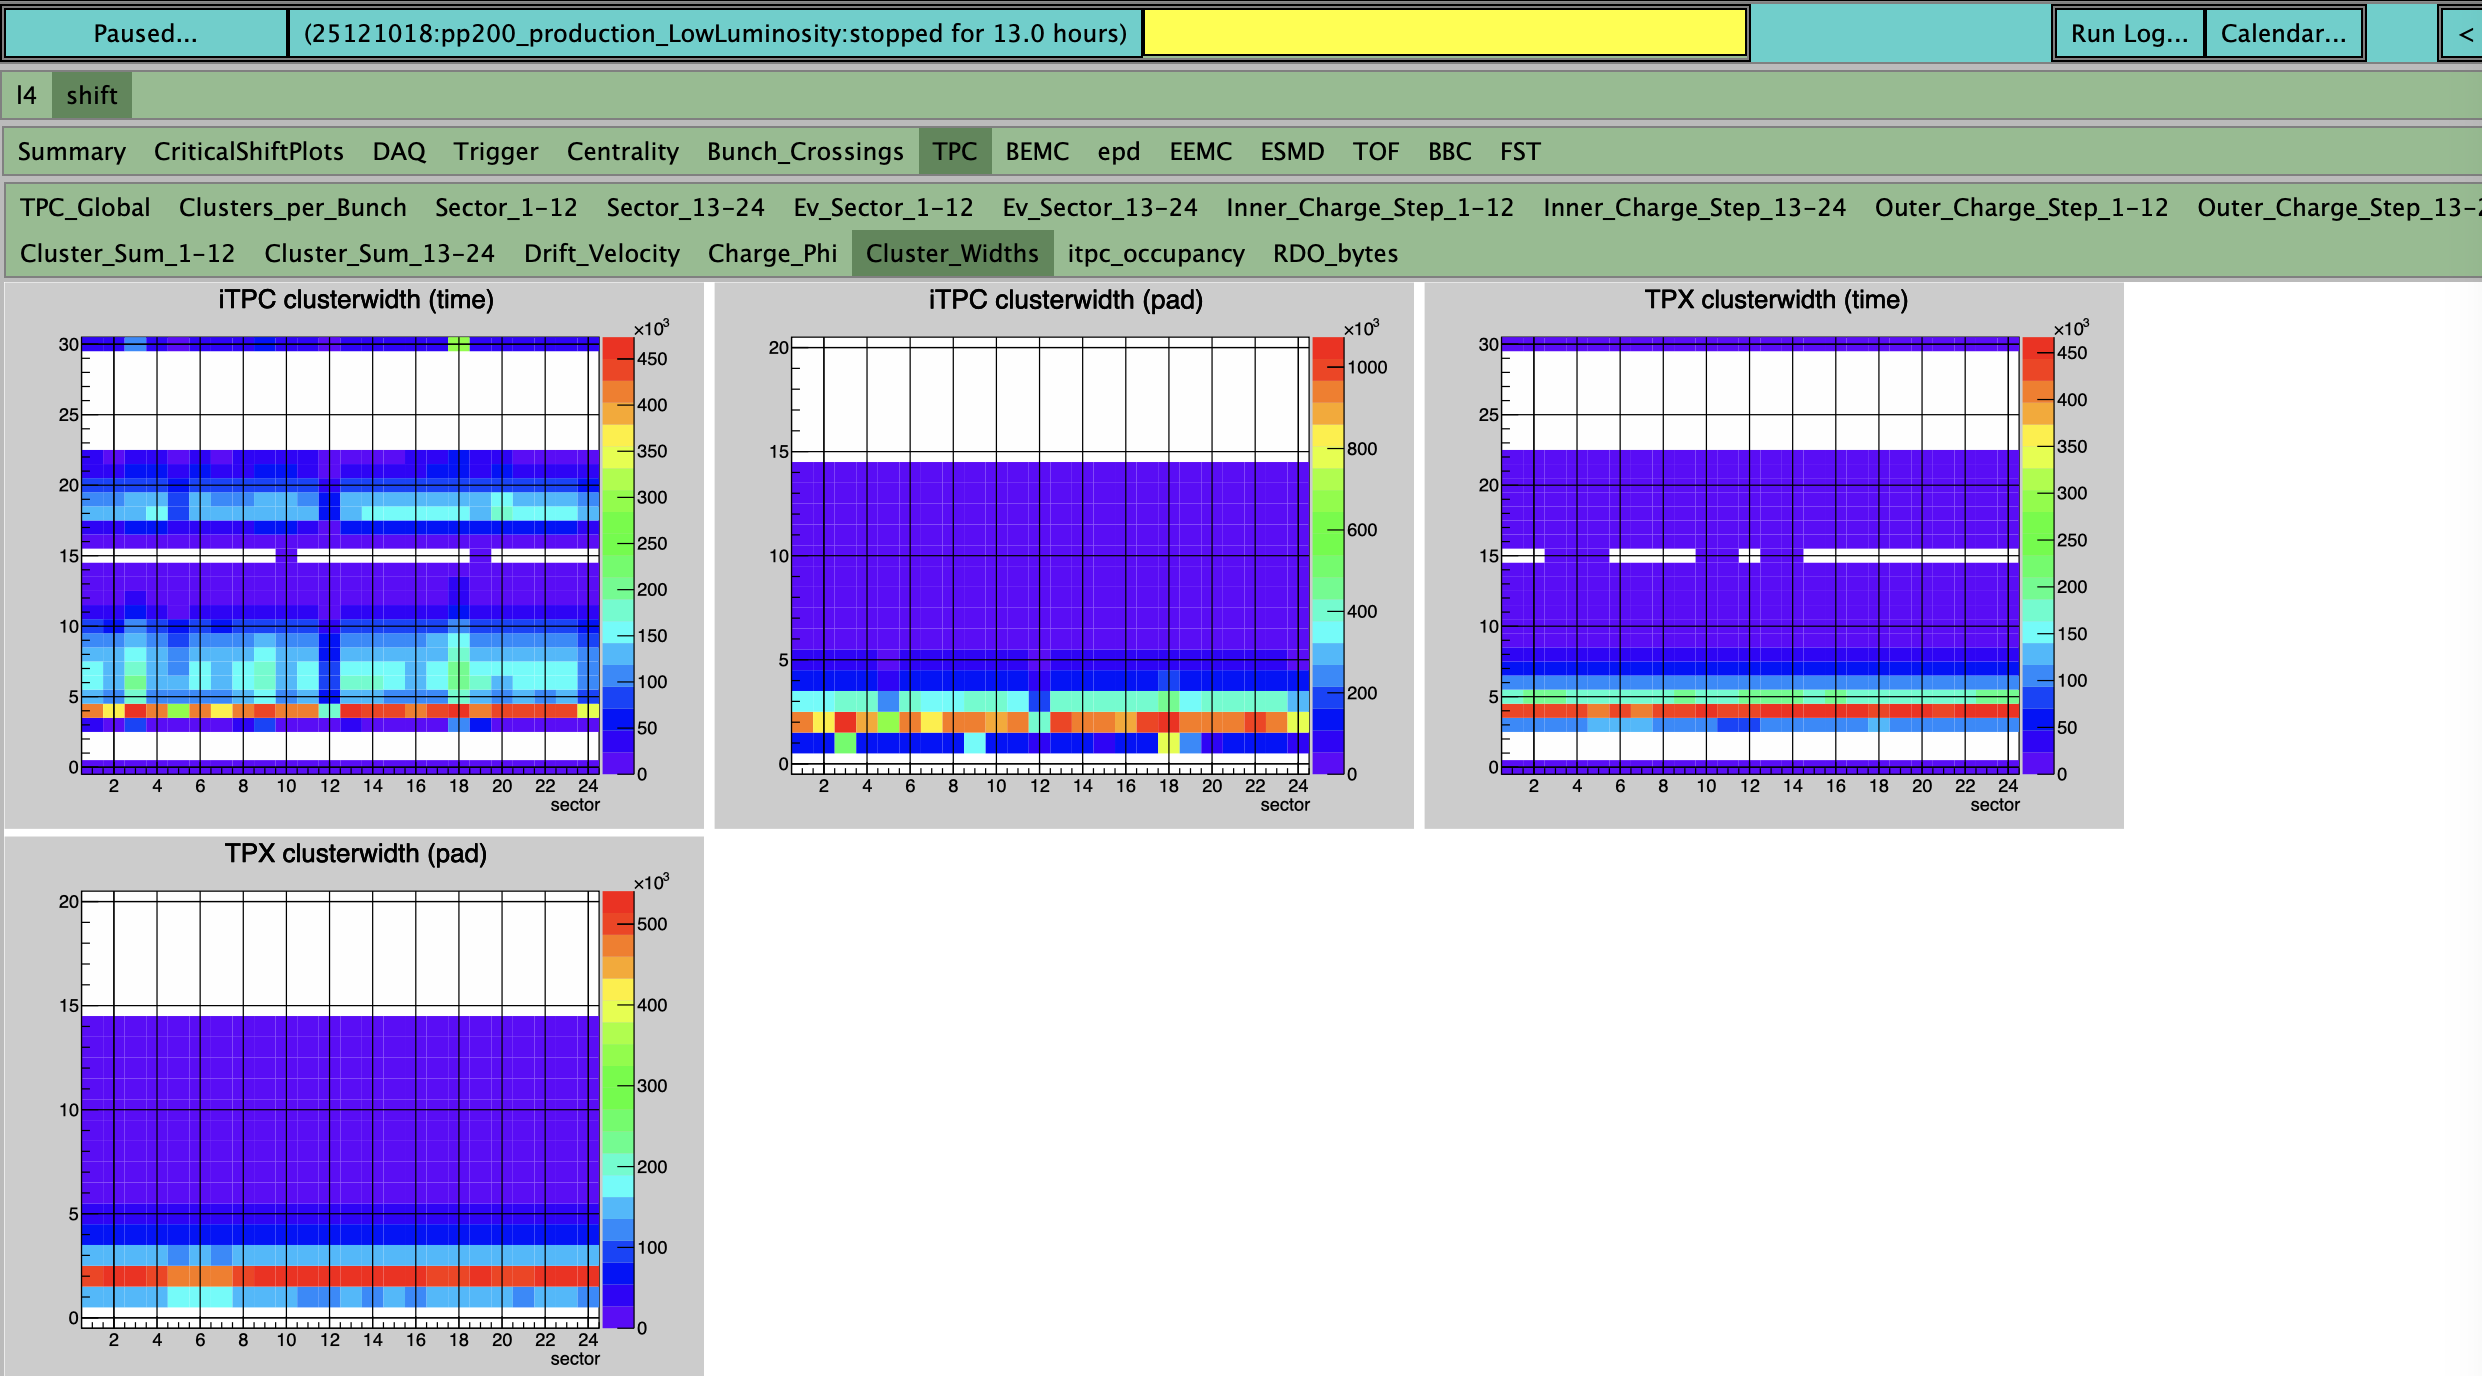
Looking at cluster size distributions as they are recorded in in the online plots, and also in the fastoffline QA plots I am trying to understand the features that I see. It is exemplyfied by the following snap shot

This is for run 161018 from today April 30, 2024.
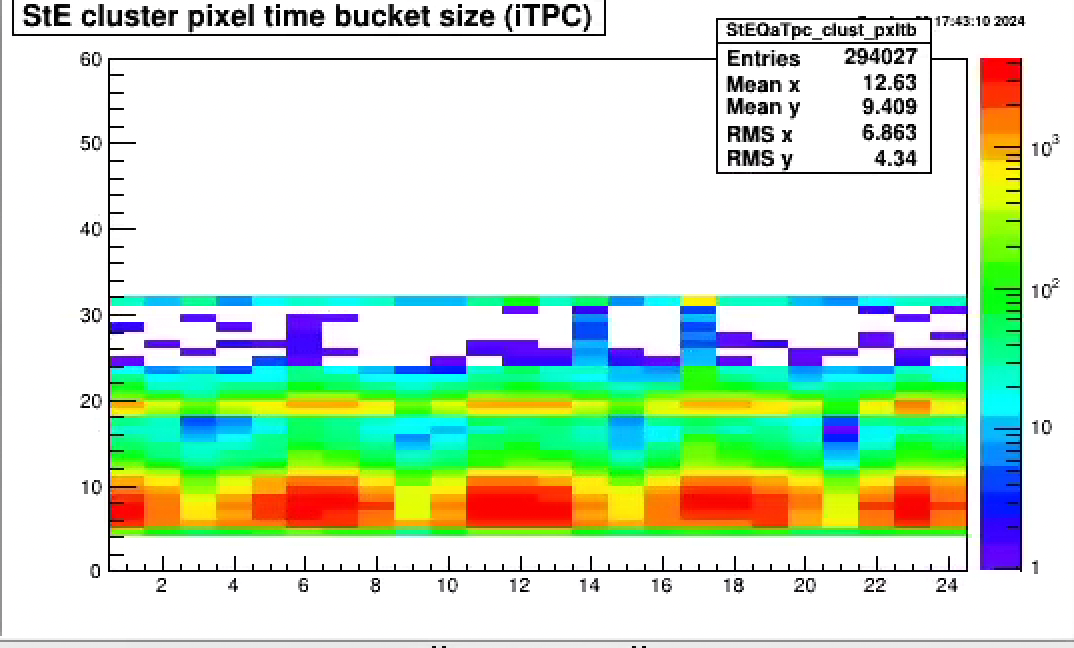
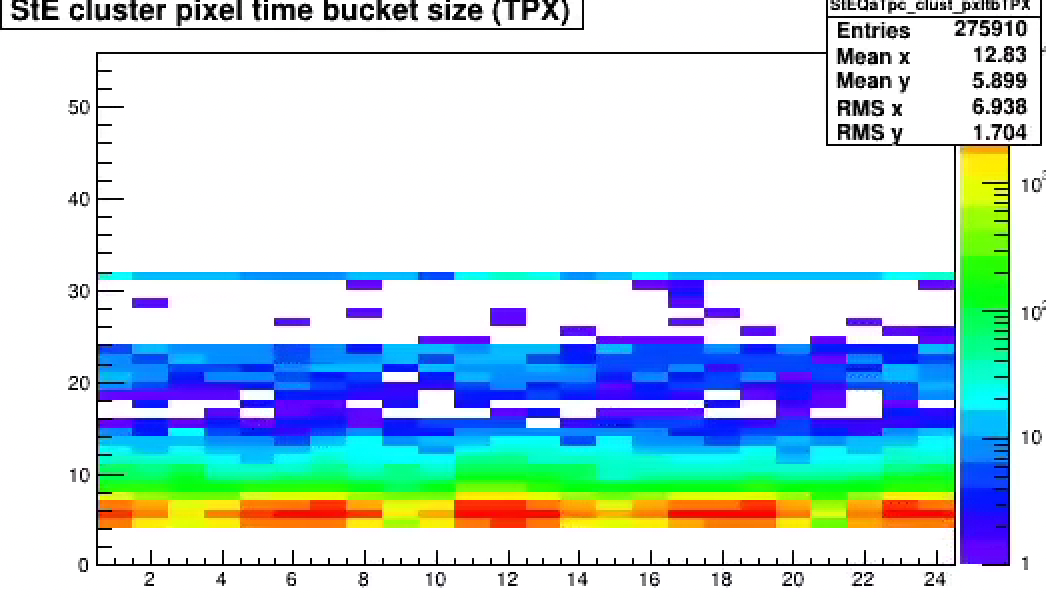
Notice that for iTPC timebin width , but also for TPX with lower ratio's, you see a main band for tb (t2-t1) of 4 and secondary bands at around 7 and again at 18.
The intensity at 7 and ~18 is considerable around 20% of the peak intensity at 4.
The entries in the plot is made for cluster flag of 0 and 2 i.e. either isolated or de-convoluted.
So I looked in more details (5/1/2024)
-- the lower band are for de-convoluted clusters. They always has the same size, which I in retrospect already knew.
-- the band at ~7 is regular low total charge states with peak charge of 20-50 adc counts)
-- the second band are very high integrated charge , and they have very longer tails in the time distributions.
-- It is still peculiar they are disjoint from the smaller time clusters. This may because these are really background, and low momentum heavier particles. Does anyone remember what threshold we were running in 22,23 and 24 for iTPC?
What I am worried about is that by having debugging printout. There are very many small clusters with counts just aove threshods i.e. 4 -5 counts. That looks to me being noise. 4 is nominally quiet far above the nominal pedestal with of 0.9-1.4.
I will try to quantify this more. The L4 plots actually helps in understanding this
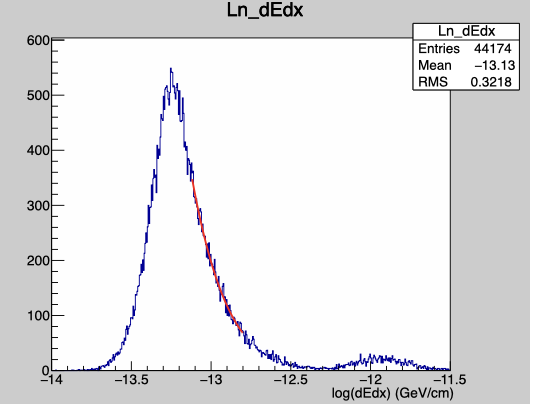
The de/dx for global tracks have two peaks, with the high one being heavier fragments certainly d'd are observed

As beam conditions were of varying quality I thought this could have been the reason, but realized this is also seen in
cosmic data before the run 24 (see below) with diffferent intensity. For cosmics this cannot be from background neither from pileup.
These are single clusters and no de-convolution.


It is also present in the TPX, which I saw by looking at the fast-offline plots which has same histograms. But with slightly smaller ratio.
It is NOT present in iTPC/TPX data for run 22 which only has the dominate ~4 TB band.
So what is the issues.
- having clusters with 20-30 timebins is about 2 microsec and implies a bad time resolutions for hits
-- these are likely mainly highly ionizing particles.
- Earlier data for run 22 , both cosmics and pp 500 data with high lumi has smooth distributions in TB distributions.
Could this be due to modified cluster algorithms? Partly since de-convolutions are done differently
Additional see lost of tiny noise cluster just above trhreshold ( with primarely 4 adc count and short 4-10 tb
Groups:
- videbaks's blog
- Login or register to post comments
