- videbaks's home page
- Posts
- 2025
- 2024
- 2023
- 2022
- 2021
- 2020
- 2019
- 2018
- December (1)
- November (2)
- October (1)
- September (1)
- August (1)
- July (4)
- April (3)
- March (1)
- February (2)
- January (1)
- 2017
- 2016
- November (1)
- September (2)
- August (2)
- July (1)
- June (1)
- May (1)
- April (1)
- March (1)
- February (1)
- January (1)
- 2015
- 2014
- 2013
- 2012
- 2011
- 2010
- November (3)
- 2009
- My blog
- Post new blog entry
- All blogs
TPC pp510 response
Jan 16, 2021
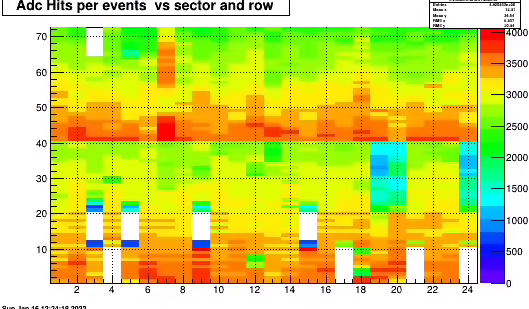
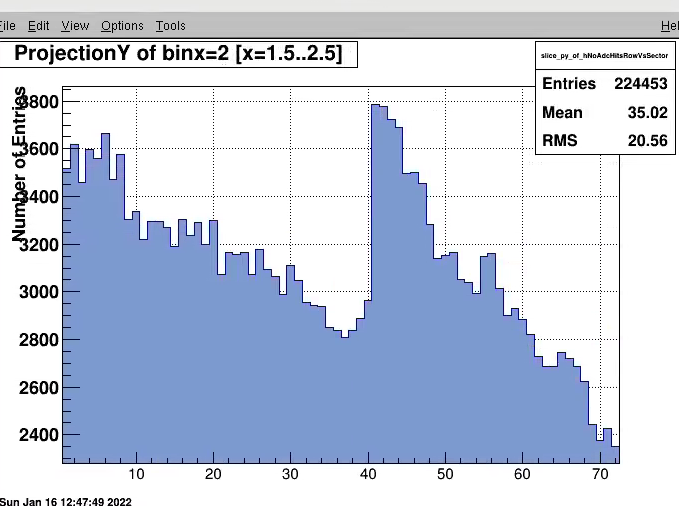
Per request #of adc points per room over all timebins from 1 to 420. lower plot in row dist (from projection)
Jan10
Went back to a low lumi run to look at the excess clusters mentioned by Tonko.
It seems to come from the deconvoluted clusters both for low and high lumi runs. See the 3 plots below (the top right is sector 1)
In all cases the transition from inner to outer is smooth.
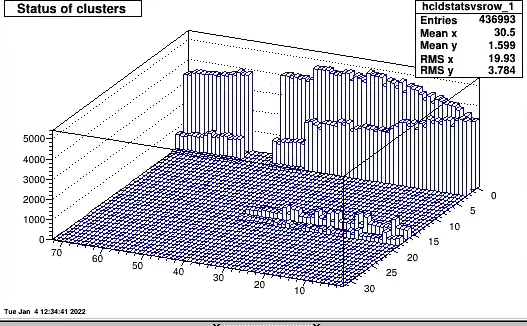
Jan 9. I looked at run 009010 and made similar plots for clusters vs. row but also showed total
The total #clusters in itps is pretty which In my opinion is due to the not find all clusters you would expect a flat foo with R.
In any case this is proper representation of the data volume.
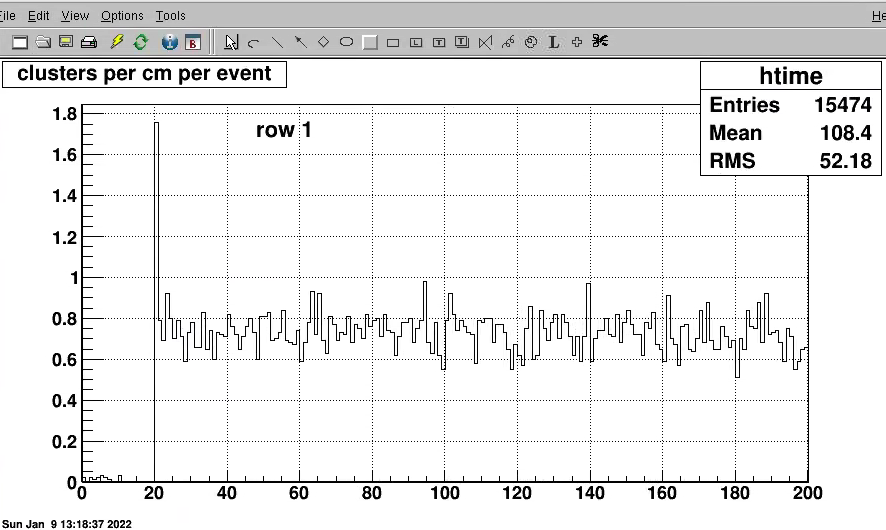
The second plot shows clusters pr cm per event for row 1 (for the whole row ). Same run
January 4, 2021
The lumi+background is very high for pp500 now. Here are some plot from looking at some recent high lumi runs
runs 23003061 BBC rich scalers 2.8MHz run 23004027 3.2Hz
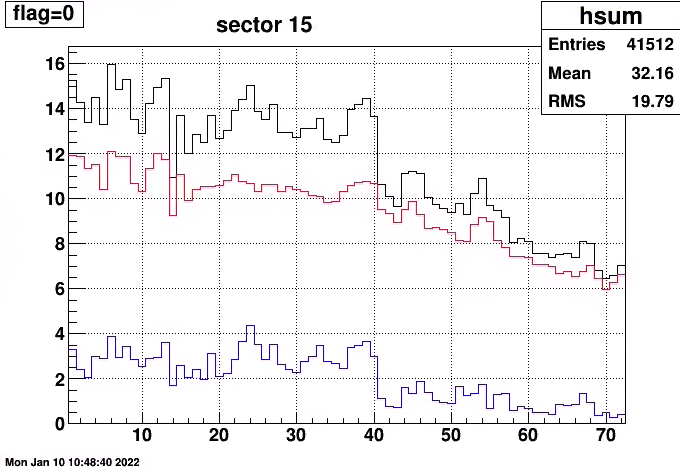
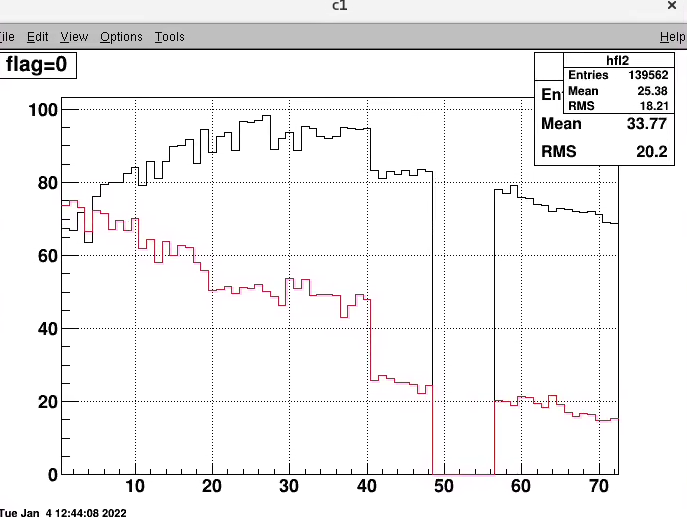
Cluster types in sector 1 (typical case)
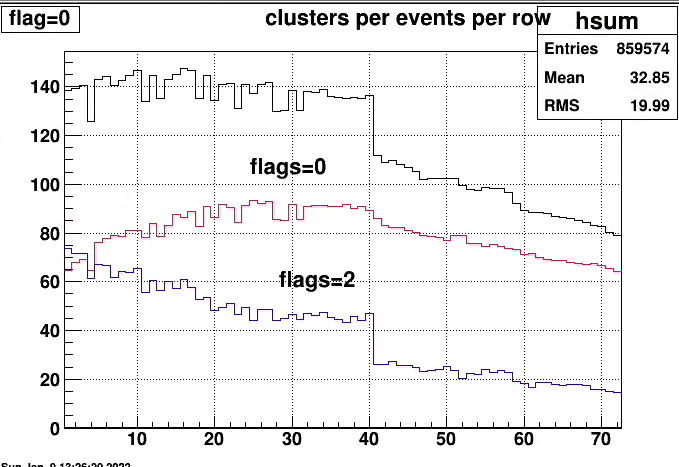
Cluster flag==0 regular cluster flag=2 deconvoluted Roughly equal amount for each type at padrow 1.
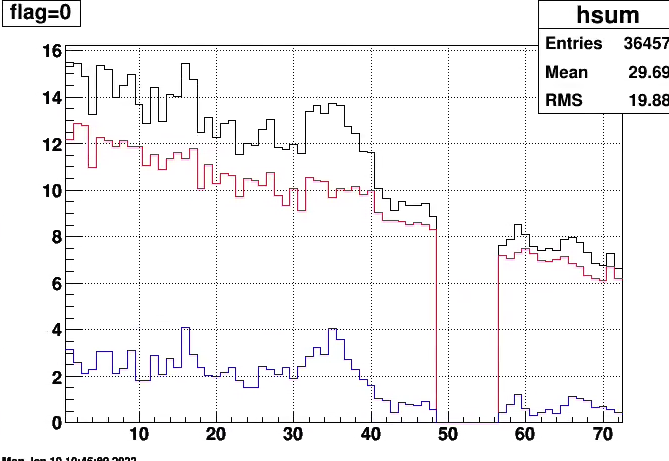
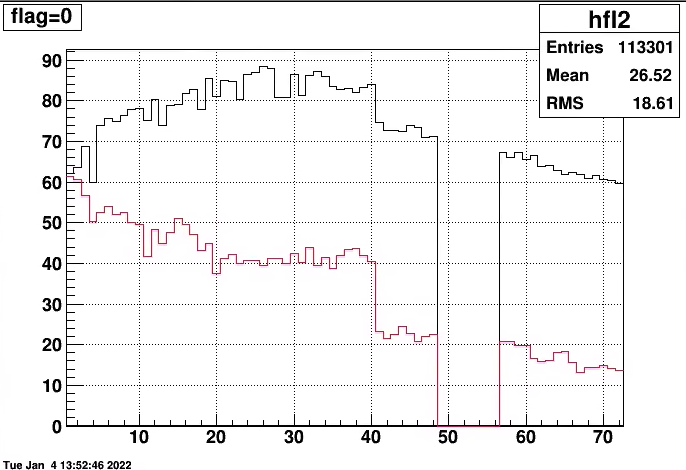
To check this in some more detail the above information was compared for sector 1 and normalized per event. Event by event variation are not large as event is dominated by minbias pile up events.First plot is for run 003061 and lower one 004027
The cluster charge vs. row for sector 1 from run003061 is shown here. Looks pretty normal

There was question about the cluster sizes. Typical cae i.e sixe on time and pad direction. Actual bins used is #+1.
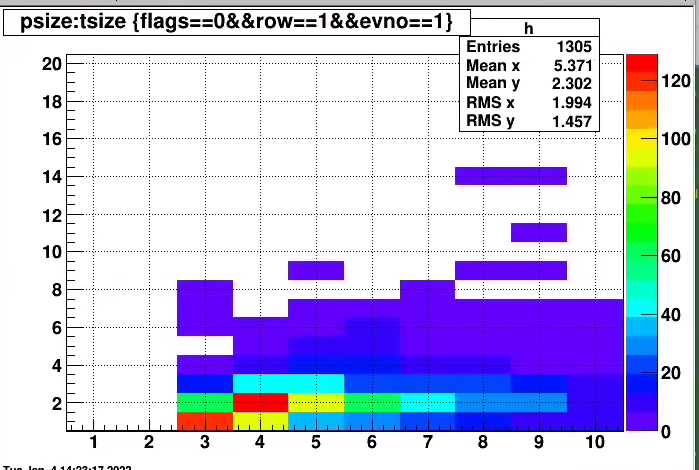
I do not show the deconvolutes clusters ; they are always 4*2 by design.
- videbaks's blog
- Login or register to post comments