HFTpredictions
Projections for remainder of pp 200 GeV and pAu 200 GeV run
From the daily statistics that Jamie assembles , I have a script that runs over fill information and
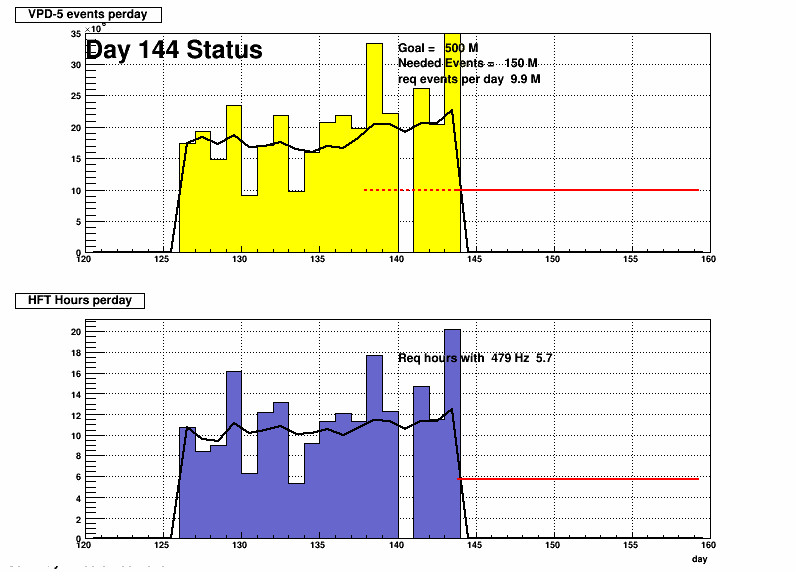
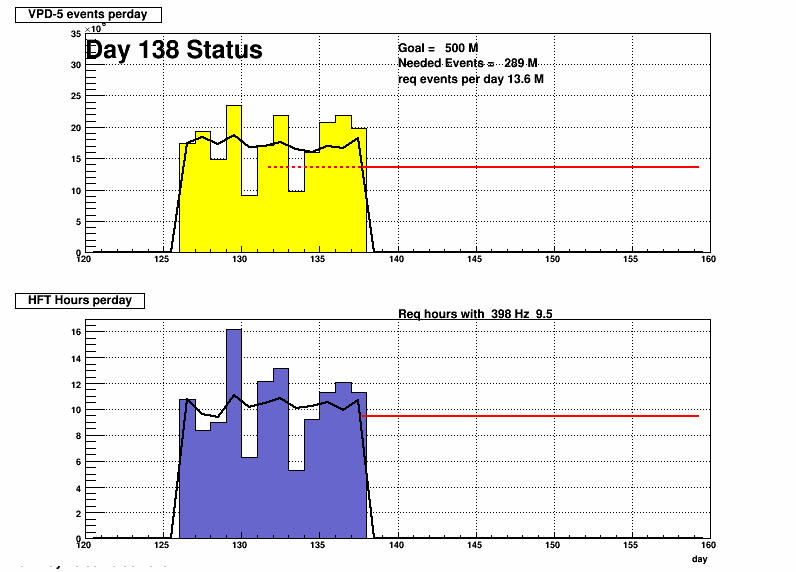
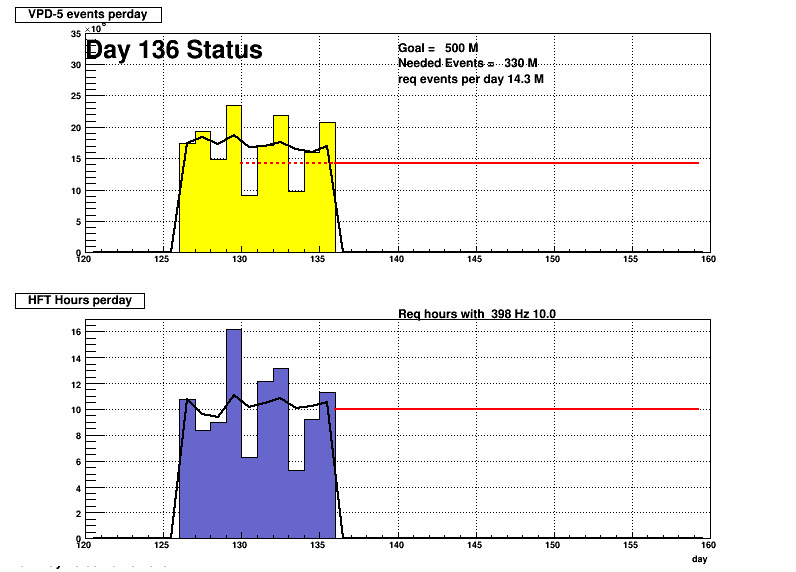
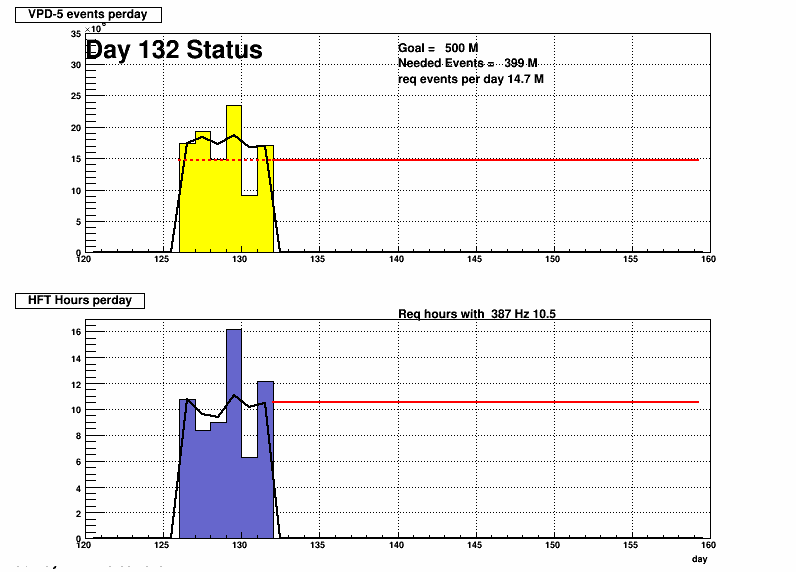
gather information on events per day. The plots per day has two panels.
pAu running
- the projected end date is June 8 follwoed by ~10 days of pAl
- On the May 16/17 we lost a power supply, so pxl was out for about 12 hours.
Day 144 May 24
Day 138 May 18
Day 136, May 16
Day 132 May 13 (this is an access day)
Day 131
.png)
notes for pp
pp200 done. In essence goal was reached (-6M)
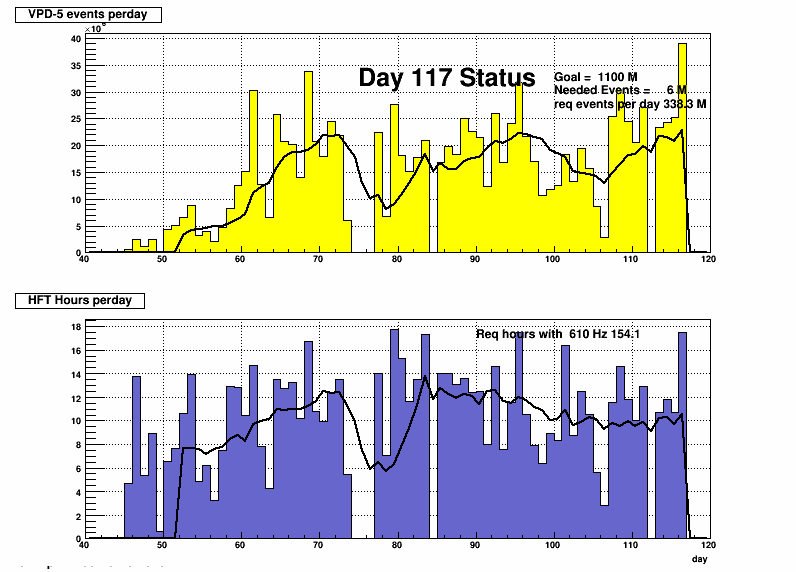
Day 115 (April 25)
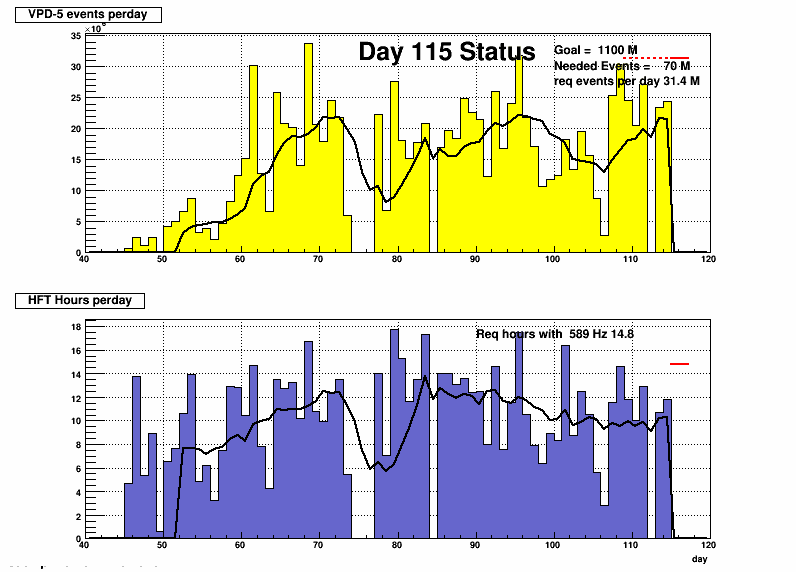
Day 114 (April 24)
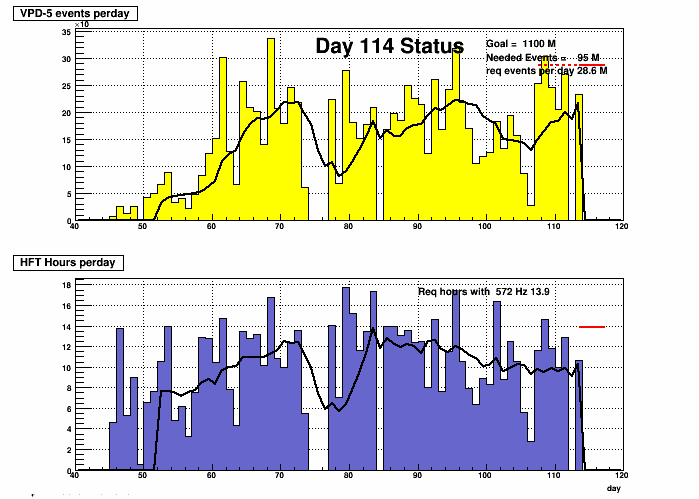
Day 112 (April 22)
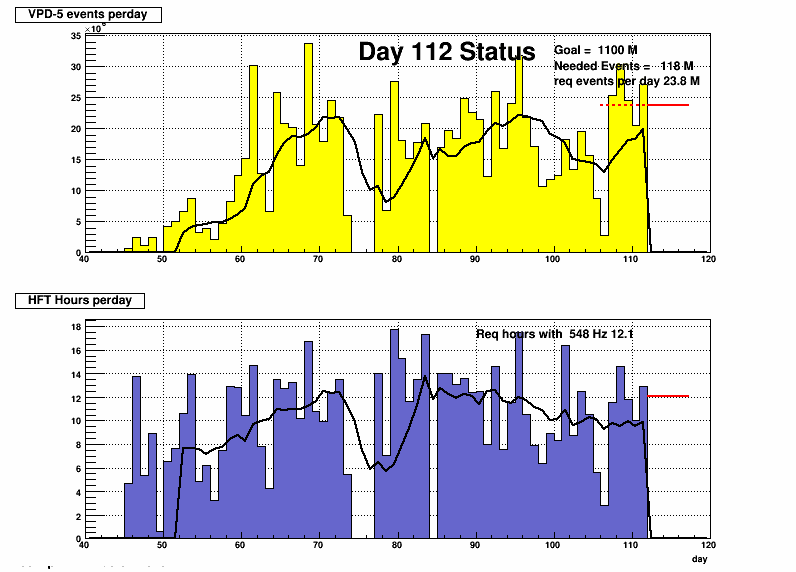
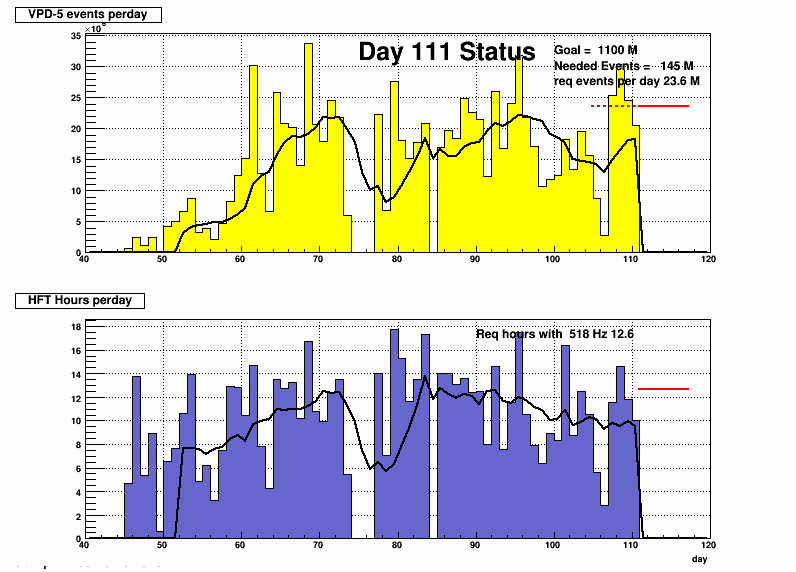
Day 111 (April 21)
The algoritm to calculate average needed per day was modified to account for proper end-effects in accounting with only 6 days left. The 16 hours APEX has not been subtracted.
Day 110 (April 20)
The algorithm to evaluate the average rate was modified to take avarage over last 7 days and use that number to project
average number of hours needed per day with HFT included. Its now ~12 which is a very reasonble number to reach the goal;
previous plots used the average since store18787.
.png)
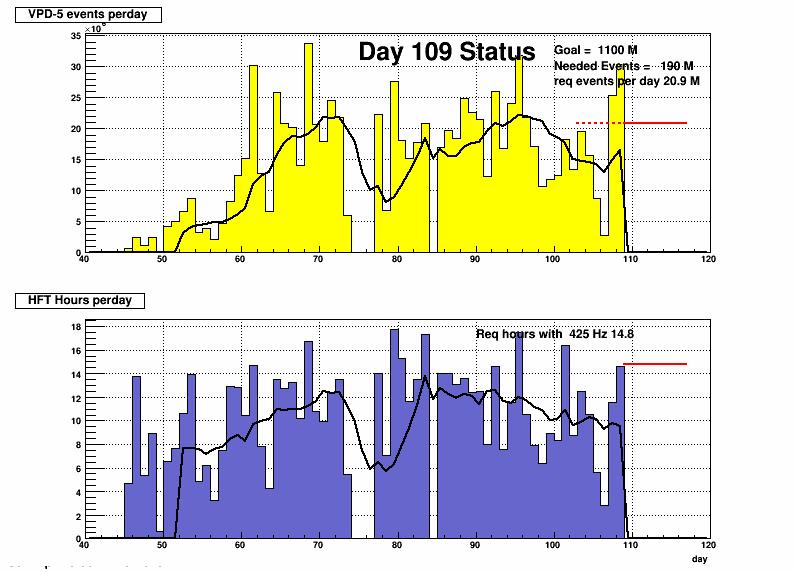
Day 109 (April 19)
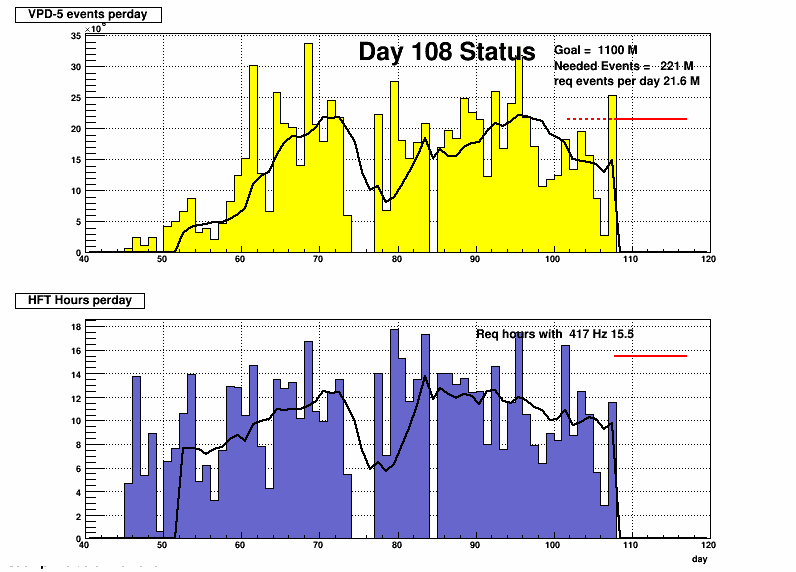
Day 108 (April 18)
Rates were adjusted and went into effect when beam cam back in the evening. Looks good
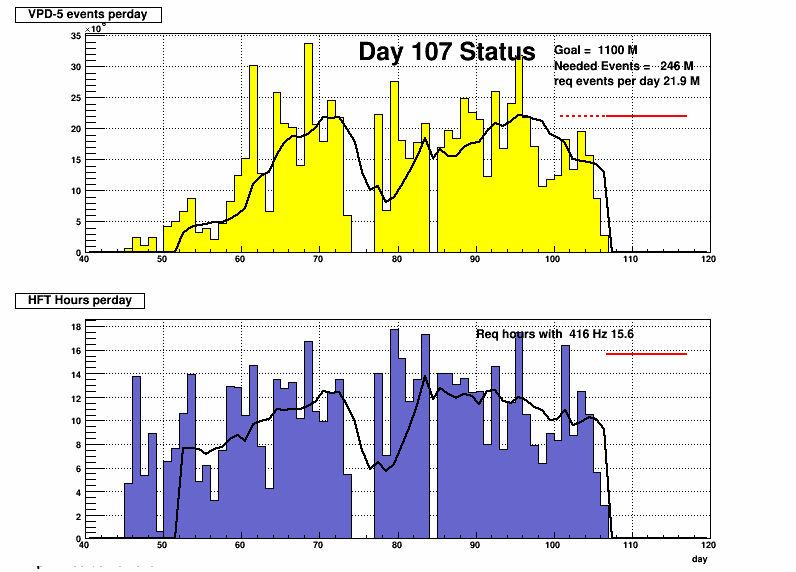
Day 107 (April 17)
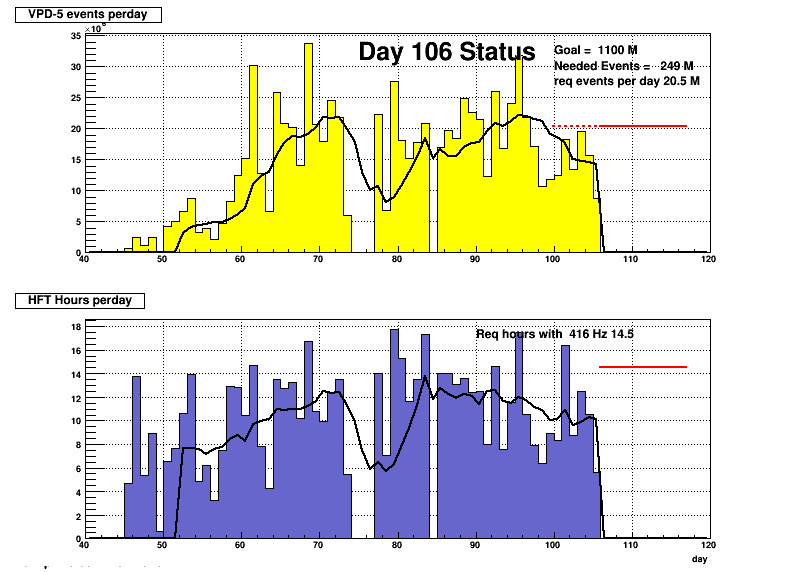
Day 106 ( April 16)
Day 105 ( April 15 - tax day)
Day 104
.png)
.png)
Entry from March 24 before extension
I will certainly be a great help to get the extension of ~10days. I do
like to point out we are not out of the woods. The last several stores
has increases baserate which implies the HFT average goes down
Se the first plot The second plot shows the projection with and average
HFT rate of 330 which we do not get. in L increases.
You can see the needed rate is about 424 for average 10.5 data taking
per day . The weekend was higher
but wilt continue through the wee. I like to point out these projection
is bases on current rates , and not the ~440 which I think are in
Jamie=E2=80=99s projection implicit.
I short I believe we are at a point where programs that reach their goal
should be cut back, or one take a little bit from most triggers
From the daily statistics that Jamie assembles , I have a script that runs over fill information and
gather information on events per day. The plots per day has two panels.
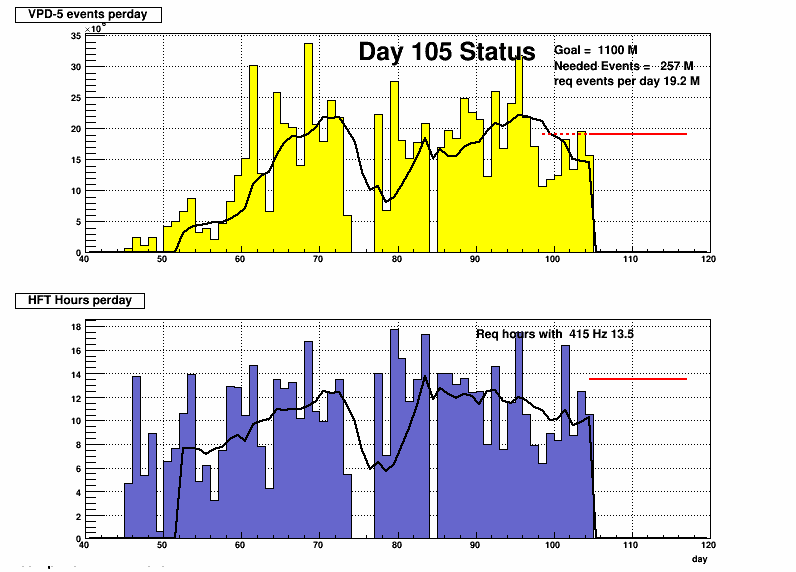
- The top shows events per day, the 7-day running average (black curve), events needed total and per day to reach the goal
- The bottom panel shows the hours per day that hft has taken data, and the projection on hours needed per day using the average rate that hft took data in nominal lengh stores , ie 7.5 hours, over the last 7 days.
pAu running
- the projected end date is June 8 follwoed by ~10 days of pAl
- On the May 16/17 we lost a power supply, so pxl was out for about 12 hours.
Day 144 May 24

Day 138 May 18

Day 136, May 16

Day 132 May 13 (this is an access day)

Day 131
.png)
notes for pp
- On day 106 The IST was out for an entire fill. The data taken with SSD+PXL do not show up in Jamies Plot, nor in the data files
- Day 113 was APEX.
- On Day 115 the last store that extended into Saturday lost 11.4M events dues to TPX programming mistake introduced after some tests.
pp200 done. In essence goal was reached (-6M)

Day 115 (April 25)

Day 114 (April 24)

Day 112 (April 22)

Day 111 (April 21)
The algoritm to calculate average needed per day was modified to account for proper end-effects in accounting with only 6 days left. The 16 hours APEX has not been subtracted.

Day 110 (April 20)
The algorithm to evaluate the average rate was modified to take avarage over last 7 days and use that number to project
average number of hours needed per day with HFT included. Its now ~12 which is a very reasonble number to reach the goal;
previous plots used the average since store18787.
.png)
Day 109 (April 19)

Day 108 (April 18)
Rates were adjusted and went into effect when beam cam back in the evening. Looks good

Day 107 (April 17)

Day 106 ( April 16)

Day 105 ( April 15 - tax day)

Day 104
.png)
Entry from March 24 before extension
I will certainly be a great help to get the extension of ~10days. I do
like to point out we are not out of the woods. The last several stores
has increases baserate which implies the HFT average goes down
Se the first plot The second plot shows the projection with and average
HFT rate of 330 which we do not get. in L increases.
You can see the needed rate is about 424 for average 10.5 data taking
per day . The weekend was higher
but wilt continue through the wee. I like to point out these projection
is bases on current rates , and not the ~440 which I think are in
Jamie=E2=80=99s projection implicit.
I short I believe we are at a point where programs that reach their goal
should be cut back, or one take a little bit from most triggers
Groups:
- videbaks's blog
- Login or register to post comments
