iTPC -- TPC QA run22
Updated on Mon, 2022-04-18 11:00. Originally created by videbaks on 2021-11-05 11:52.
Run 22 ended on April 18.
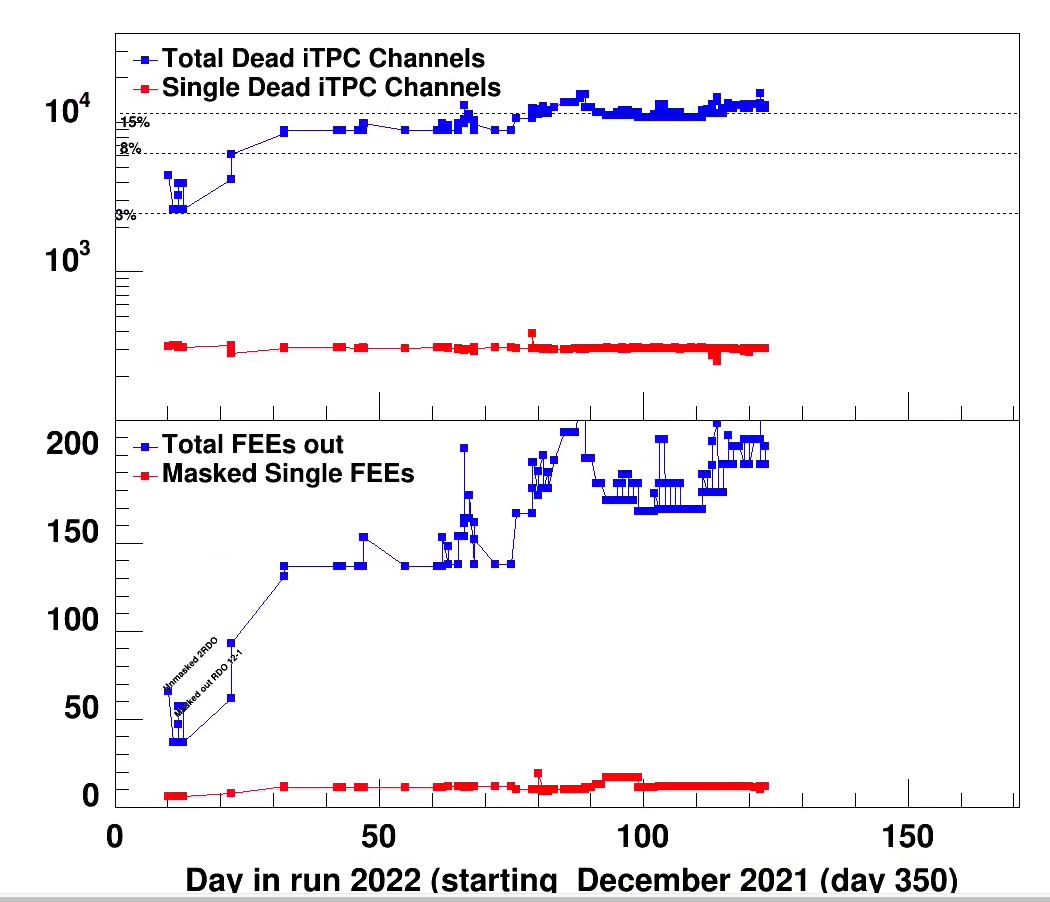
At the end there was 205 masked out FEEs in the iTPC. this is about 18%
See attached plots.
The distribution of dead RDOs at end of run is West (1-12) 2 iTPC 0 TPX East (13-24) 12 RDO and 2TPX
On March 4 Lanny reported an issue (seen earlier in a few other runs) that some parts TPX within one RDO is less efficient.
One example is run 23057040 where sector 17 had this happening.
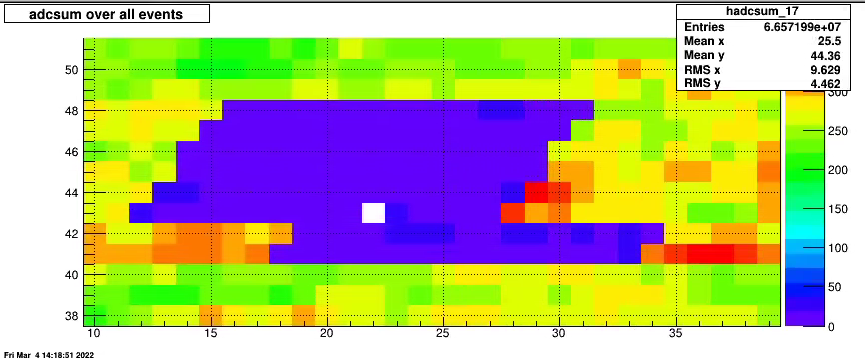
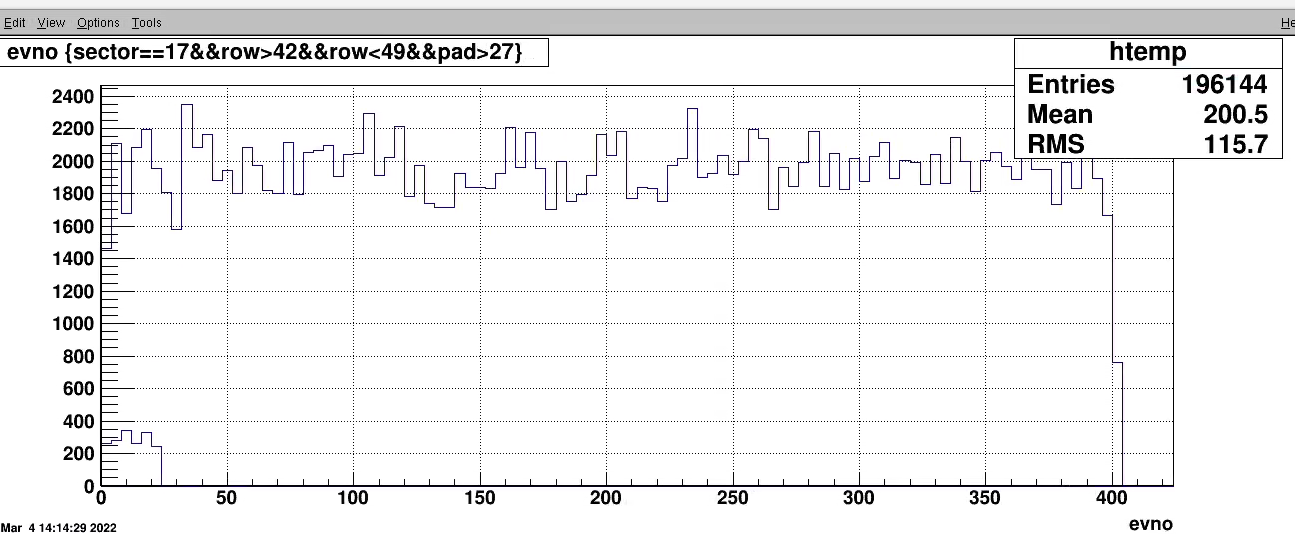
Looked at the clusters vs. 'evno (entry in tree file' for a subset of data, all from one evb). for pads in the inefficient region and plotted on same 1D plot for entries outside
the ineff region.
It can be seen the ineff region looks ok in beginning of run and then disapeers. The two selection has not been normalized many more entries in outside region.
Suggestion: some SEU disables 4 FEE's. What should be done? Ask SC to look for such regions during data taking, stop the run and mark as questionable (mark only tpc readout data as such). Do similar for offline QA.
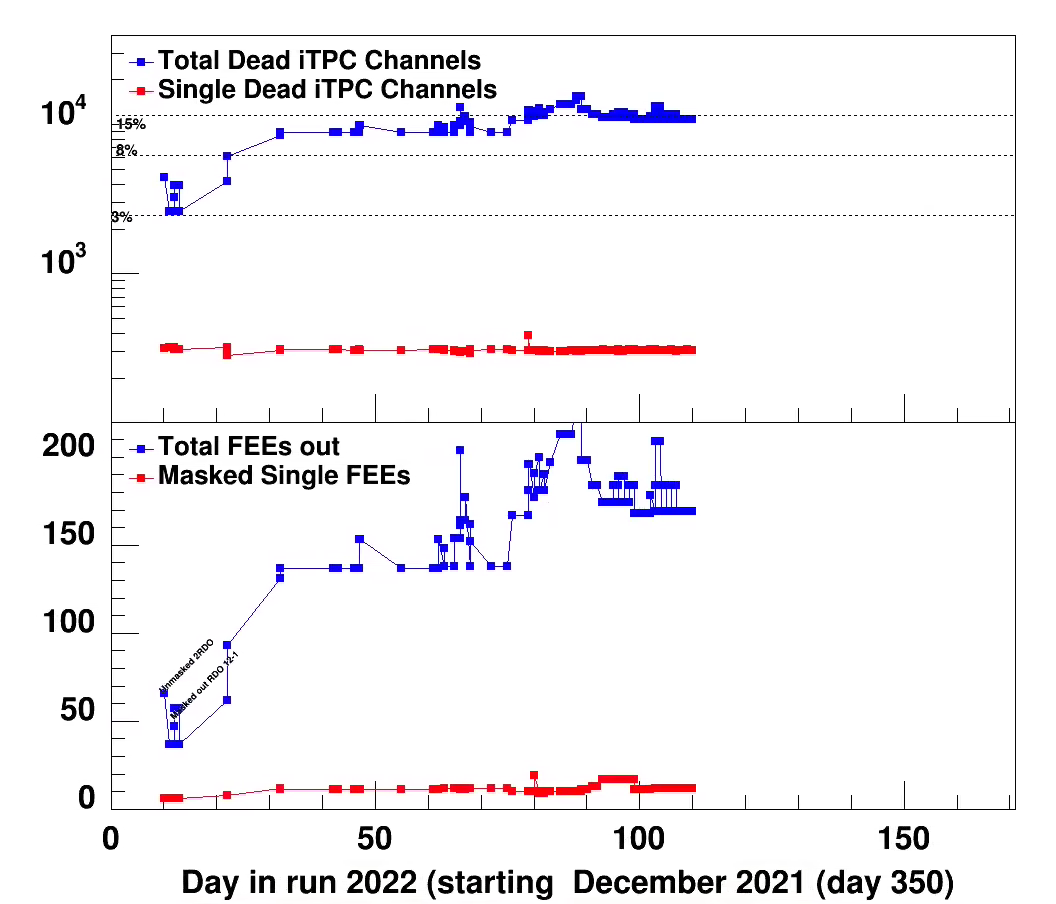
dead channel status plot vs run (3/4/2022)-> 4/5/2022
Feb 10 RDO status from Tonko's google doc
Jan 12
There are so many RDO on/off daily som its is becomming tedius to follow this in detail
Will go to mode to look for hot/dead channels and not when FEEs are lost only.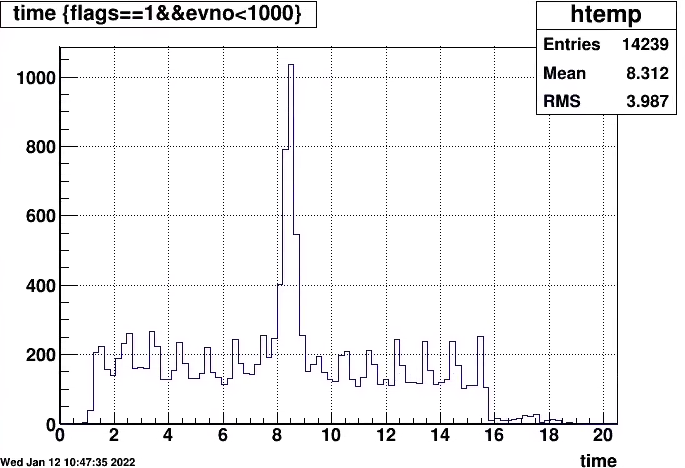
It works fine.
He also remove some clusters with flag x10 (next to edge or dead pad.
Jan 12
Tonko reomved all single-pad clusters apart from prompt region (TPX only).
Jan 1
Update by Tonko one resurrection lots of RDO
I recovered 10 out of 13 masked iTPC RDOs:
* 1 had a FEE die so I masked just that FEE
* 7 had PROM failures but I could re-program the PROM
* 2 were working fine so either a cockpit error or some intermittent
problem, TBD
So right now we have 3 (out of 96 total) iRDOs masked:
* 1 has trigger problems
* 2 are dead in the sense that the main FPGA doesn't talk over the fiber.
The power is present at the RDO but it could be general malfunction or could be
a very badly damaged PROM so I can't boot the FPGA in any of the 2
redundant images.
Nothing can be done without access.
It seems that we can count on 3-4 PROM failures per day with this beam.
Perhaps going to 5-6 RDOs per day. Let's just hope all are recoverable.
Also, if this continues I will need to write a procedure on how to do this
so that the Shifcrew can do it on the spot instead of accumulating
~5 dead iRDOs per day. It takes approximately 10 minutes per board
at this stage of software sophistication but could be made into ~5
with some effort.
DEC 29
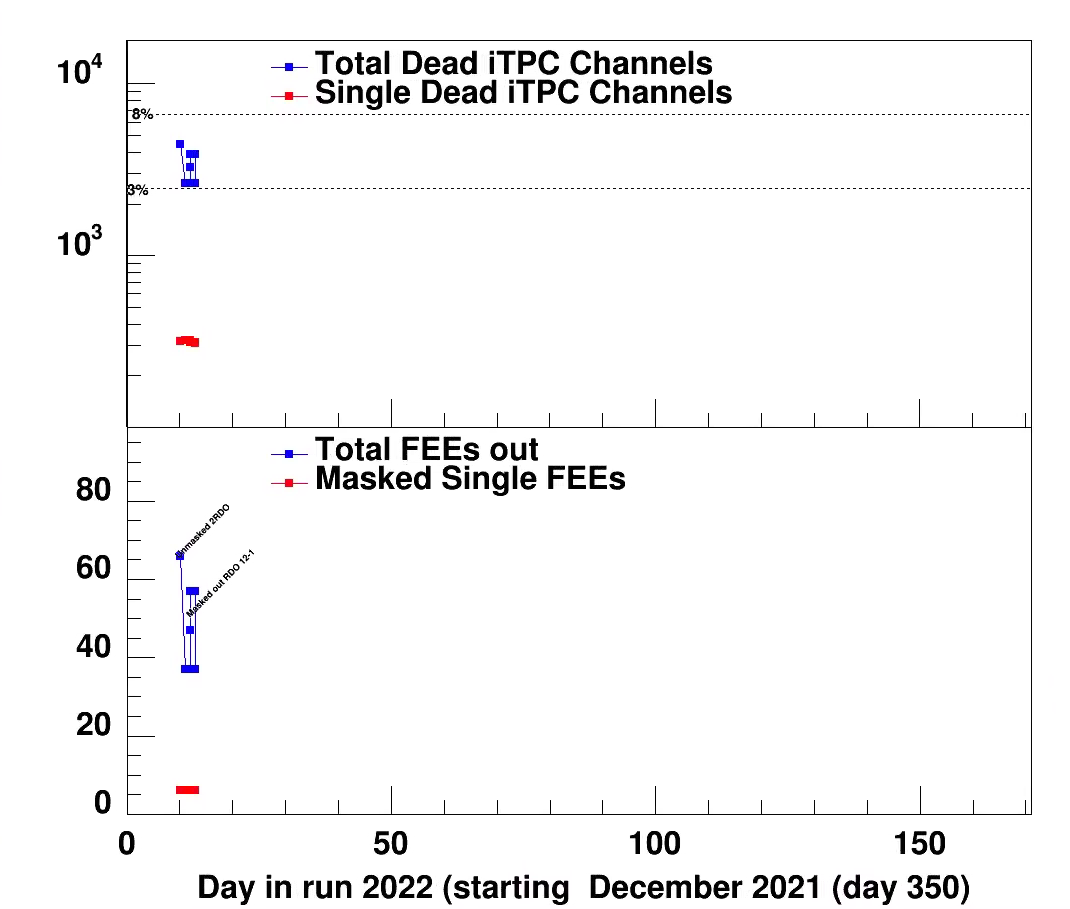
Updated summay plots
DEC 28
Updated plot code, and starting creating bad pad list, FEE results
At present I leave dates before Dec 26 out
Dec 28
DEC 28 run 362013
First run started @ 03:11 am; which is almost 40 min from physics declared to be ON. Many trials to start to start the run failed due to the unsuccessful recovery of iTPC from a 100% dead rate. After few manual powercycle of iTPC sector 12, RDO 1, I ended up masking it out for the trigger configuration.
Dec 15
It was discovered that sector 21 seem to be open all the time. We flipped the output oon the gating grids to go to 9 and vice versa.
Time has also measured a smaller capaciteance. As the sector still was open after the swith we concluded the problem is with the cable and the connection on the sector.
Tim:
he twinax cables have ~20pf / foot. So 100 feet would give us ~2.0nf, which is about what I am seeing to ground. So it looks like we are reading mostly capacitance from the cable."
Bill suggest to measure with a pulser on the scope the signal reflection and determine where it happens.
For now keep the HV to 800V below the
Dec 10
RDO 13-3 was in and out; now out. Tonko observed in his google doc
December Dec 4
Sunday morning:
Unmasking iTPC 13:3 led to:
09:48:15 1 itpc13 CRITICAL itpcMain esbTask.C:#2830 ITPC: sector 13, RDO 3 failed: Powercycle this RDO manually with Slow Controls & restart run.
09:48:15 1 itpc13 CRITICAL itpcMain itpc.C:#2893 ITPC: Sector 13, RDO 3 -- powercycle manually!
This was the fourth failure in a row for iTPC 13:3. So we didn't powercycle it. I masked it instead.
Status November 22 2019
- After running cosmics for a couple of weeks several more RDO's are out.
It should be noted that Tonko has not had time to look at these in details due to fcs and stgc work.
TPX 1-4
ITPC 4-3, 18-1, 20-3, 24-4
Early November (11/5)
Tonko have done the pulser gain calibration, and committed to cvs repository
online/RTS/src/TPX_SUPPORT/tpx_gains.txt
and
online/RTS/src/ITPC_SUPPORT/itpc_gains.txt
In itpc
sector 4-RDO4 Fee 8 is out 62 channels
sector 5 RDO2 Fee 14 60 channels
sector 18 RDO-1 Fee 16 64 channels
In total 497 Bad channels
311 single pad marked as bad.
in TPX all is good
-- gating grid checks. Jeff setup a special configuration to be able to read ADC data from the TPC at a frequency of ~4 Hz. The idea was to look for nosie, so an analysis tpcadcGG where to integrate charge
around an area of 70-80 ch which is the end of GG influence and look at that vs. sequence number.
Initial test had no anode voltage on just nosie (white+ any from GG). Some histogram show typical behaviour.
As of 11/8 we had only been able to run a single files.
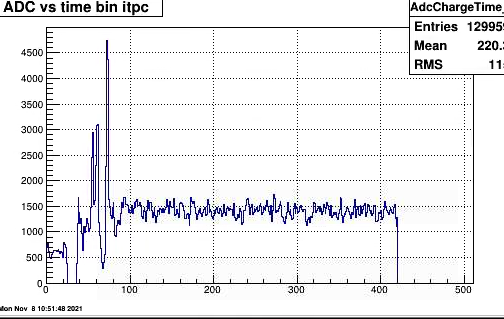
Time distribution for one sector (itpc) of adc values from all pads, rows.The ADC value are just above threshold typically 4 or 5, and looking at some printout
in order of 2 timebins . occasionally 3.
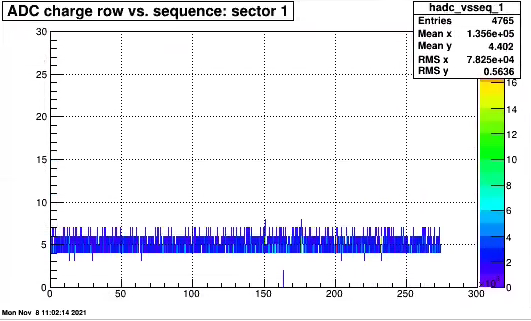
This shows ADC counts vs sequence; demonstrates statement above.
There are a few more noisy channels one of the worst were sector 17 (p,r)=(13,5)
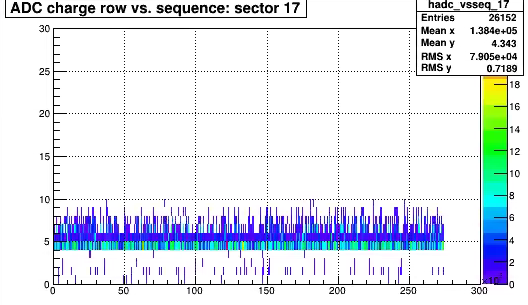
Slight more noise.
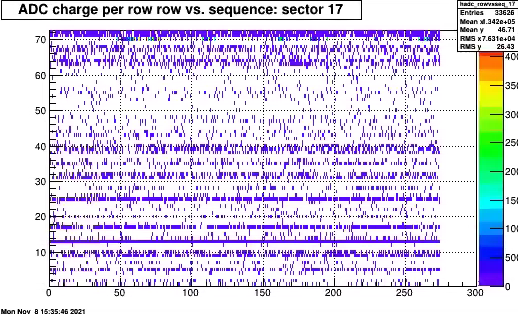
.png)
Normal kind of distribution . By masking out in readout the particular channel all QA plots look good
Conclusions:
These are just the tails of the input noise that leaks through the threshold. It is also noted that no
clusters has been created due to this noise
At the end there was 205 masked out FEEs in the iTPC. this is about 18%
See attached plots.
The distribution of dead RDOs at end of run is West (1-12) 2 iTPC 0 TPX East (13-24) 12 RDO and 2TPX

On March 4 Lanny reported an issue (seen earlier in a few other runs) that some parts TPX within one RDO is less efficient.
One example is run 23057040 where sector 17 had this happening.

Looked at the clusters vs. 'evno (entry in tree file' for a subset of data, all from one evb). for pads in the inefficient region and plotted on same 1D plot for entries outside
the ineff region.
It can be seen the ineff region looks ok in beginning of run and then disapeers. The two selection has not been normalized many more entries in outside region.
Suggestion: some SEU disables 4 FEE's. What should be done? Ask SC to look for such regions during data taking, stop the run and mark as questionable (mark only tpc readout data as such). Do similar for offline QA.

dead channel status plot vs run (3/4/2022)-> 4/5/2022

Feb 10 RDO status from Tonko's google doc
-
10-Feb – recap for convenience
iTPC
iS3-2 power
iS11-2 PROMs
iS15-3 PROMs
-
iS17-1 PROM#1 but can’t reprogram
-
iS17-4 PROMs
-
iS19-4 PROMs
-
iS20-3 trigger iface
-
iS24-1 PROMs
-
iS24-4 trigger iface
-
TPX
-
iS22-3 dead; trunner doesn’t execute
-
Jan 12
There are so many RDO on/off daily som its is becomming tedius to follow this in detail
Will go to mode to look for hot/dead channels and not when FEEs are lost only.

It works fine.
He also remove some clusters with flag x10 (next to edge or dead pad.
Jan 12
Tonko reomved all single-pad clusters apart from prompt region (TPX only).
Jan 1
Update by Tonko one resurrection lots of RDO
I recovered 10 out of 13 masked iTPC RDOs:
* 1 had a FEE die so I masked just that FEE
* 7 had PROM failures but I could re-program the PROM
* 2 were working fine so either a cockpit error or some intermittent
problem, TBD
So right now we have 3 (out of 96 total) iRDOs masked:
* 1 has trigger problems
* 2 are dead in the sense that the main FPGA doesn't talk over the fiber.
The power is present at the RDO but it could be general malfunction or could be
a very badly damaged PROM so I can't boot the FPGA in any of the 2
redundant images.
Nothing can be done without access.
It seems that we can count on 3-4 PROM failures per day with this beam.
Perhaps going to 5-6 RDOs per day. Let's just hope all are recoverable.
Also, if this continues I will need to write a procedure on how to do this
so that the Shifcrew can do it on the spot instead of accumulating
~5 dead iRDOs per day. It takes approximately 10 minutes per board
at this stage of software sophistication but could be made into ~5
with some effort.
DEC 29
Updated summay plots

| 11:18
TPC |
iTPC RDO iS12-1 again had problems but this time it was 1 particular FEE (#15) which I masked-out of the RDO so the RDO can be enabled again. |
DEC 28
Updated plot code, and starting creating bad pad list, FEE results
At present I leave dates before Dec 26 out
Dec 28
TPC
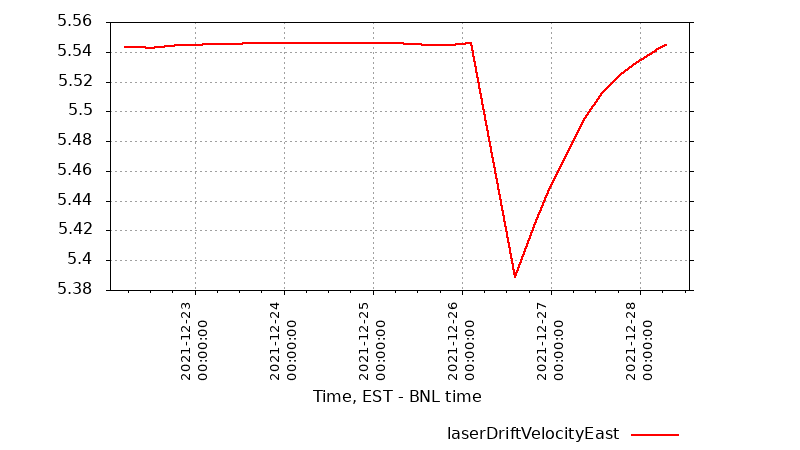
Laser drift velocities measured by the shift crew seem to be back to normal (~5.54 or so). M3 on digital gauge is 10.08 at 1007 mBar. So these data suggest that the TPC methane levels are back to where it was last week. Therefore, I lowered the excess methane flow on FM1 command setting to 1.54 on the digital gauge (1.53 on the Gas sys computer log) to match the stable settings from last week. The TPC gas system looks well tuned and stable and should stay that way as long as the barometric pressure is stable (or at least well behaved).DEC 28 run 362013
First run started @ 03:11 am; which is almost 40 min from physics declared to be ON. Many trials to start to start the run failed due to the unsuccessful recovery of iTPC from a 100% dead rate. After few manual powercycle of iTPC sector 12, RDO 1, I ended up masking it out for the trigger configuration.
Dec 15
It was discovered that sector 21 seem to be open all the time. We flipped the output oon the gating grids to go to 9 and vice versa.
Time has also measured a smaller capaciteance. As the sector still was open after the swith we concluded the problem is with the cable and the connection on the sector.
Tim:
he twinax cables have ~20pf / foot. So 100 feet would give us ~2.0nf, which is about what I am seeing to ground. So it looks like we are reading mostly capacitance from the cable."
Bill suggest to measure with a pulser on the scope the signal reflection and determine where it happens.
For now keep the HV to 800V below the
Dec 10
RDO 13-3 was in and out; now out. Tonko observed in his google doc
-
iS13-3 dead
-
I see loss of link (LOS) so this looks either like something dropping power OR
a very flaky fiber link?? -
or power cable splice is acting up??
-
December Dec 4
Sunday morning:
Unmasking iTPC 13:3 led to:
09:48:15 1 itpc13 CRITICAL itpcMain esbTask.C:#2830 ITPC: sector 13, RDO 3 failed: Powercycle this RDO manually with Slow Controls & restart run.
09:48:15 1 itpc13 CRITICAL itpcMain itpc.C:#2893 ITPC: Sector 13, RDO 3 -- powercycle manually!
This was the fourth failure in a row for iTPC 13:3. So we didn't powercycle it. I masked it instead.
Status November 22 2019
- After running cosmics for a couple of weeks several more RDO's are out.
It should be noted that Tonko has not had time to look at these in details due to fcs and stgc work.
TPX 1-4
ITPC 4-3, 18-1, 20-3, 24-4
Early November (11/5)
Tonko have done the pulser gain calibration, and committed to cvs repository
online/RTS/src/TPX_SUPPORT/tpx_gains.txt
and
online/RTS/src/ITPC_SUPPORT/itpc_gains.txt
In itpc
sector 4-RDO4 Fee 8 is out 62 channels
sector 5 RDO2 Fee 14 60 channels
sector 18 RDO-1 Fee 16 64 channels
In total 497 Bad channels
311 single pad marked as bad.
in TPX all is good
-- gating grid checks. Jeff setup a special configuration to be able to read ADC data from the TPC at a frequency of ~4 Hz. The idea was to look for nosie, so an analysis tpcadcGG where to integrate charge
around an area of 70-80 ch which is the end of GG influence and look at that vs. sequence number.
Initial test had no anode voltage on just nosie (white+ any from GG). Some histogram show typical behaviour.
As of 11/8 we had only been able to run a single files.

Time distribution for one sector (itpc) of adc values from all pads, rows.The ADC value are just above threshold typically 4 or 5, and looking at some printout
in order of 2 timebins . occasionally 3.

This shows ADC counts vs sequence; demonstrates statement above.
There are a few more noisy channels one of the worst were sector 17 (p,r)=(13,5)

Slight more noise.
.png)
Normal kind of distribution . By masking out in readout the particular channel all QA plots look good
Conclusions:
These are just the tails of the input noise that leaks through the threshold. It is also noted that no
clusters has been created due to this noise
»
- videbaks's blog
- Login or register to post comments

 - Jim Thomas