No Significant Correlation Between ZDC Luminosity and MIP Position
After our analysis of the effect of luminosity on MIP position and discovering no significant correlation, questions were raised as to the appropriateness of using the BBC as a mechanism for measuring luminosity in our analysis. It is possible that BBC saturation at high luminosity was preventing our analysis from revealing the possible target relationship. So, as per the suggestion of Gene Van Buren, we have repeated our analysis using ZDC data.
Luminosity and time data was taken from the file /star/institutions/bnl/genevb/Scalers/ScalersRunTimes2006/ntup.root, provided by Gene Van Buren, following instructions from http://drupal.star.bnl.gov/STAR/blog/genevb/2009/aug/31/rich-scaler-ntuple. Average luminosity values for fills were calculated by time-weighting the individual luminosity measurements throughout the runs for each fill. Both a constant and a linear fit were then applied to each MIP vs. luminosity plot.
Even with this new luminosity data, there is no obvious correlation between luminosity and MIP position. The following graph is representative:
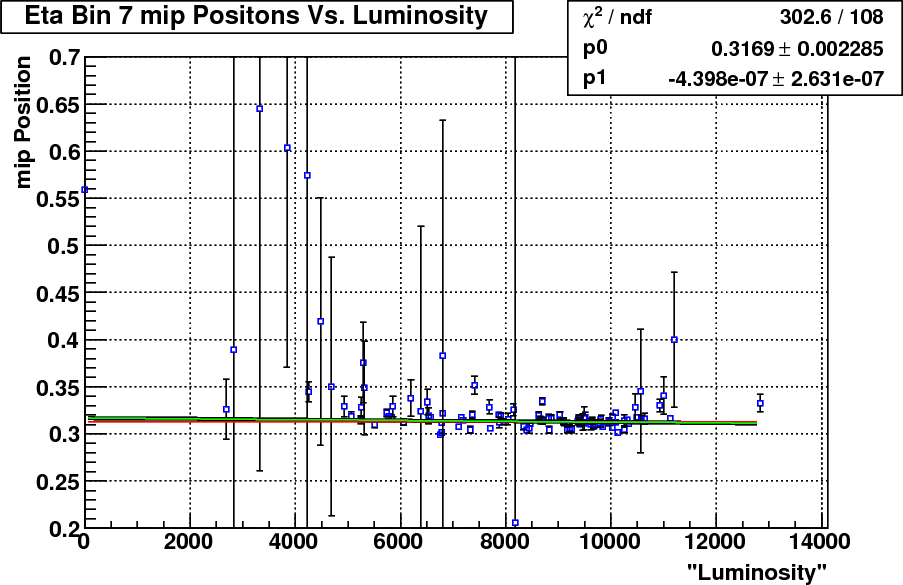
Figure 1: 2006 Eta Bin 7 MIP Position versus ZDC Luminosity, with P0 and P1 fits
The similarity between the constant and linear fits held true over all Eta bins, except for Eta bin 1, for which a reasonable linear fit could not be found. The following two graphs show the Chi^2 versus Eta bin for the constant fit (Figure 2), and for the linear fit (Figure 3) for each MIP Position versus Luminosity graph. As can be seen from the graphs, there is no apparent difference between the quality of the constant and linear fits. Indicating that a linear fit is no better than a constant fit for these data sets.
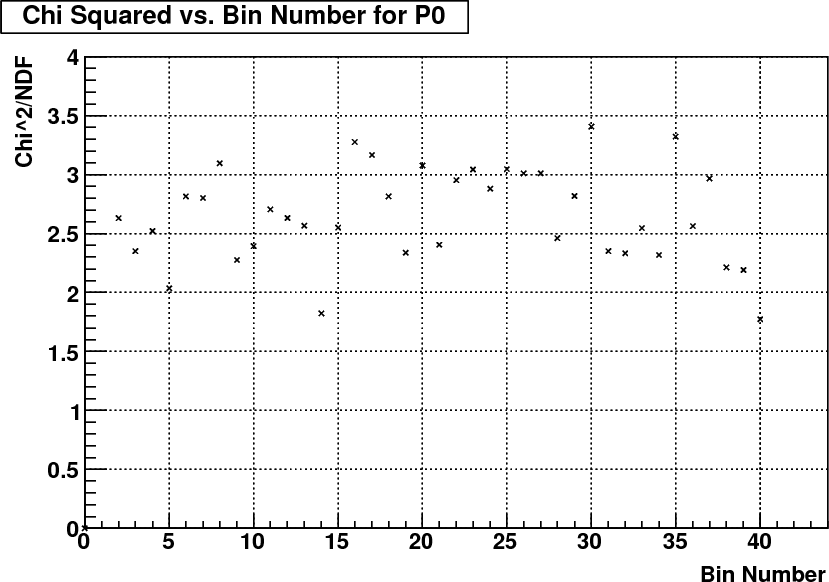
Figure 2: 2006 P1 Fit Chi^2 versus Eta Bin
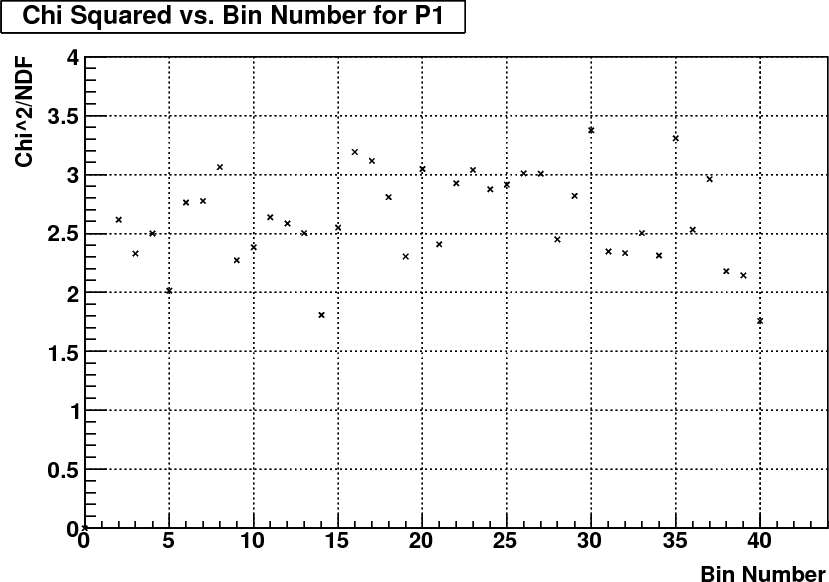
Figure 3: 2006 P1 Fit Chi^2 versus Eta Bin
A complete set of all graphs with fits, including the images displayed on this page, can be found here
- wwitzke's blog
- Login or register to post comments