- xchu's home page
- Posts
- 2024
- October (1)
- 2023
- 2022
- 2021
- December (2)
- November (1)
- October (1)
- September (1)
- August (2)
- July (1)
- June (3)
- May (2)
- April (3)
- March (1)
- 2020
- October (2)
- September (1)
- August (5)
- July (1)
- June (3)
- May (3)
- April (1)
- March (2)
- February (4)
- January (1)
- 2019
- My blog
- Post new blog entry
- All blogs
dipi0 correlation pp pAl pAu analysis preliminary results
Updated on Wed, 2022-04-06 08:38. Originally created by xchu on 2020-09-08 09:41.
Title: Dipi0 correlation in √s = 200 GeV pp, pAl and pAu collisions at STAR
Abstract: (submitted for DNP2020)
Two-particle azimuthal correlation has been proposed to be one of the most direct and sensitive channels to access the underlying nonlinear gluon dynamics. In hadron collisions at RHIC, forward particle production probes gluons at small x where the gluon densities rise sharply. During the 2015 RHIC run, STAR has collected data for measuring azimuthal correlations of neutral pions detected with the
Forward Meson Spectrometer (FMS, 2.6 ≤ η ≤ 4.0) in p+p and p+Au collisions at √sNN = 200 GeV. An analysis update, which will measure the di-hadron correlations as a function of A and transverse momenta of both the trigger π0 (1.4 GeV/c < pT < 5 GeV/c) and the associated back-to-back π0 (1 GeV/c < pT < 2.8 GeV/c), will be presented.
Plots for pp and pAu:
1. East BBC ADC Sum (BBCE) distribution in pp and pAu collisions. In pAu collisions, events are grouped into four BBCE bins: 3000<BBCE<12000, 12000<BBCE<24000, 24000<BBCE<36000, BBCE>36000. Events without BBCE selection are called MiniBias events.
.png)
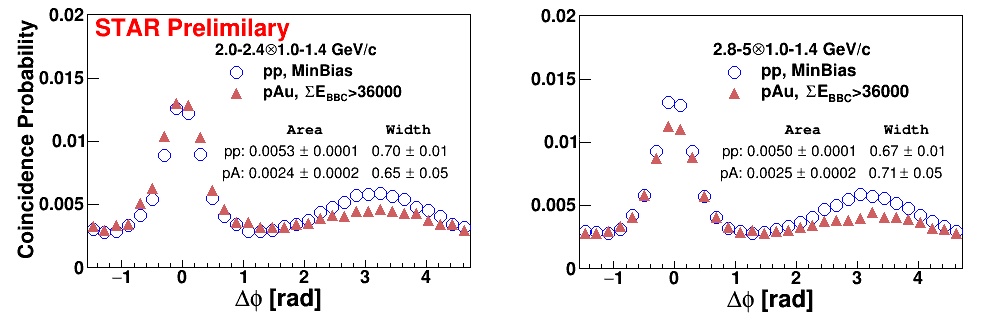
2. Correlation Vs ∆φ: MiniBias pp and high BBCE pAu comparison in two example pT ranges.
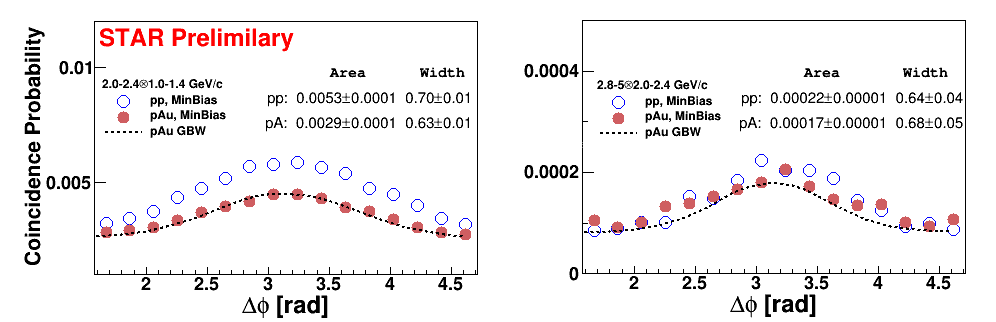
3. Correlation Vs ∆φ: MiniBias pp and MiniBias pAu comparison in two example pT ranges, together with the theory predictions based on GBW model. The reference for GBW model is Phys. Lett. B 716, 430 (2012), 1109.1817.
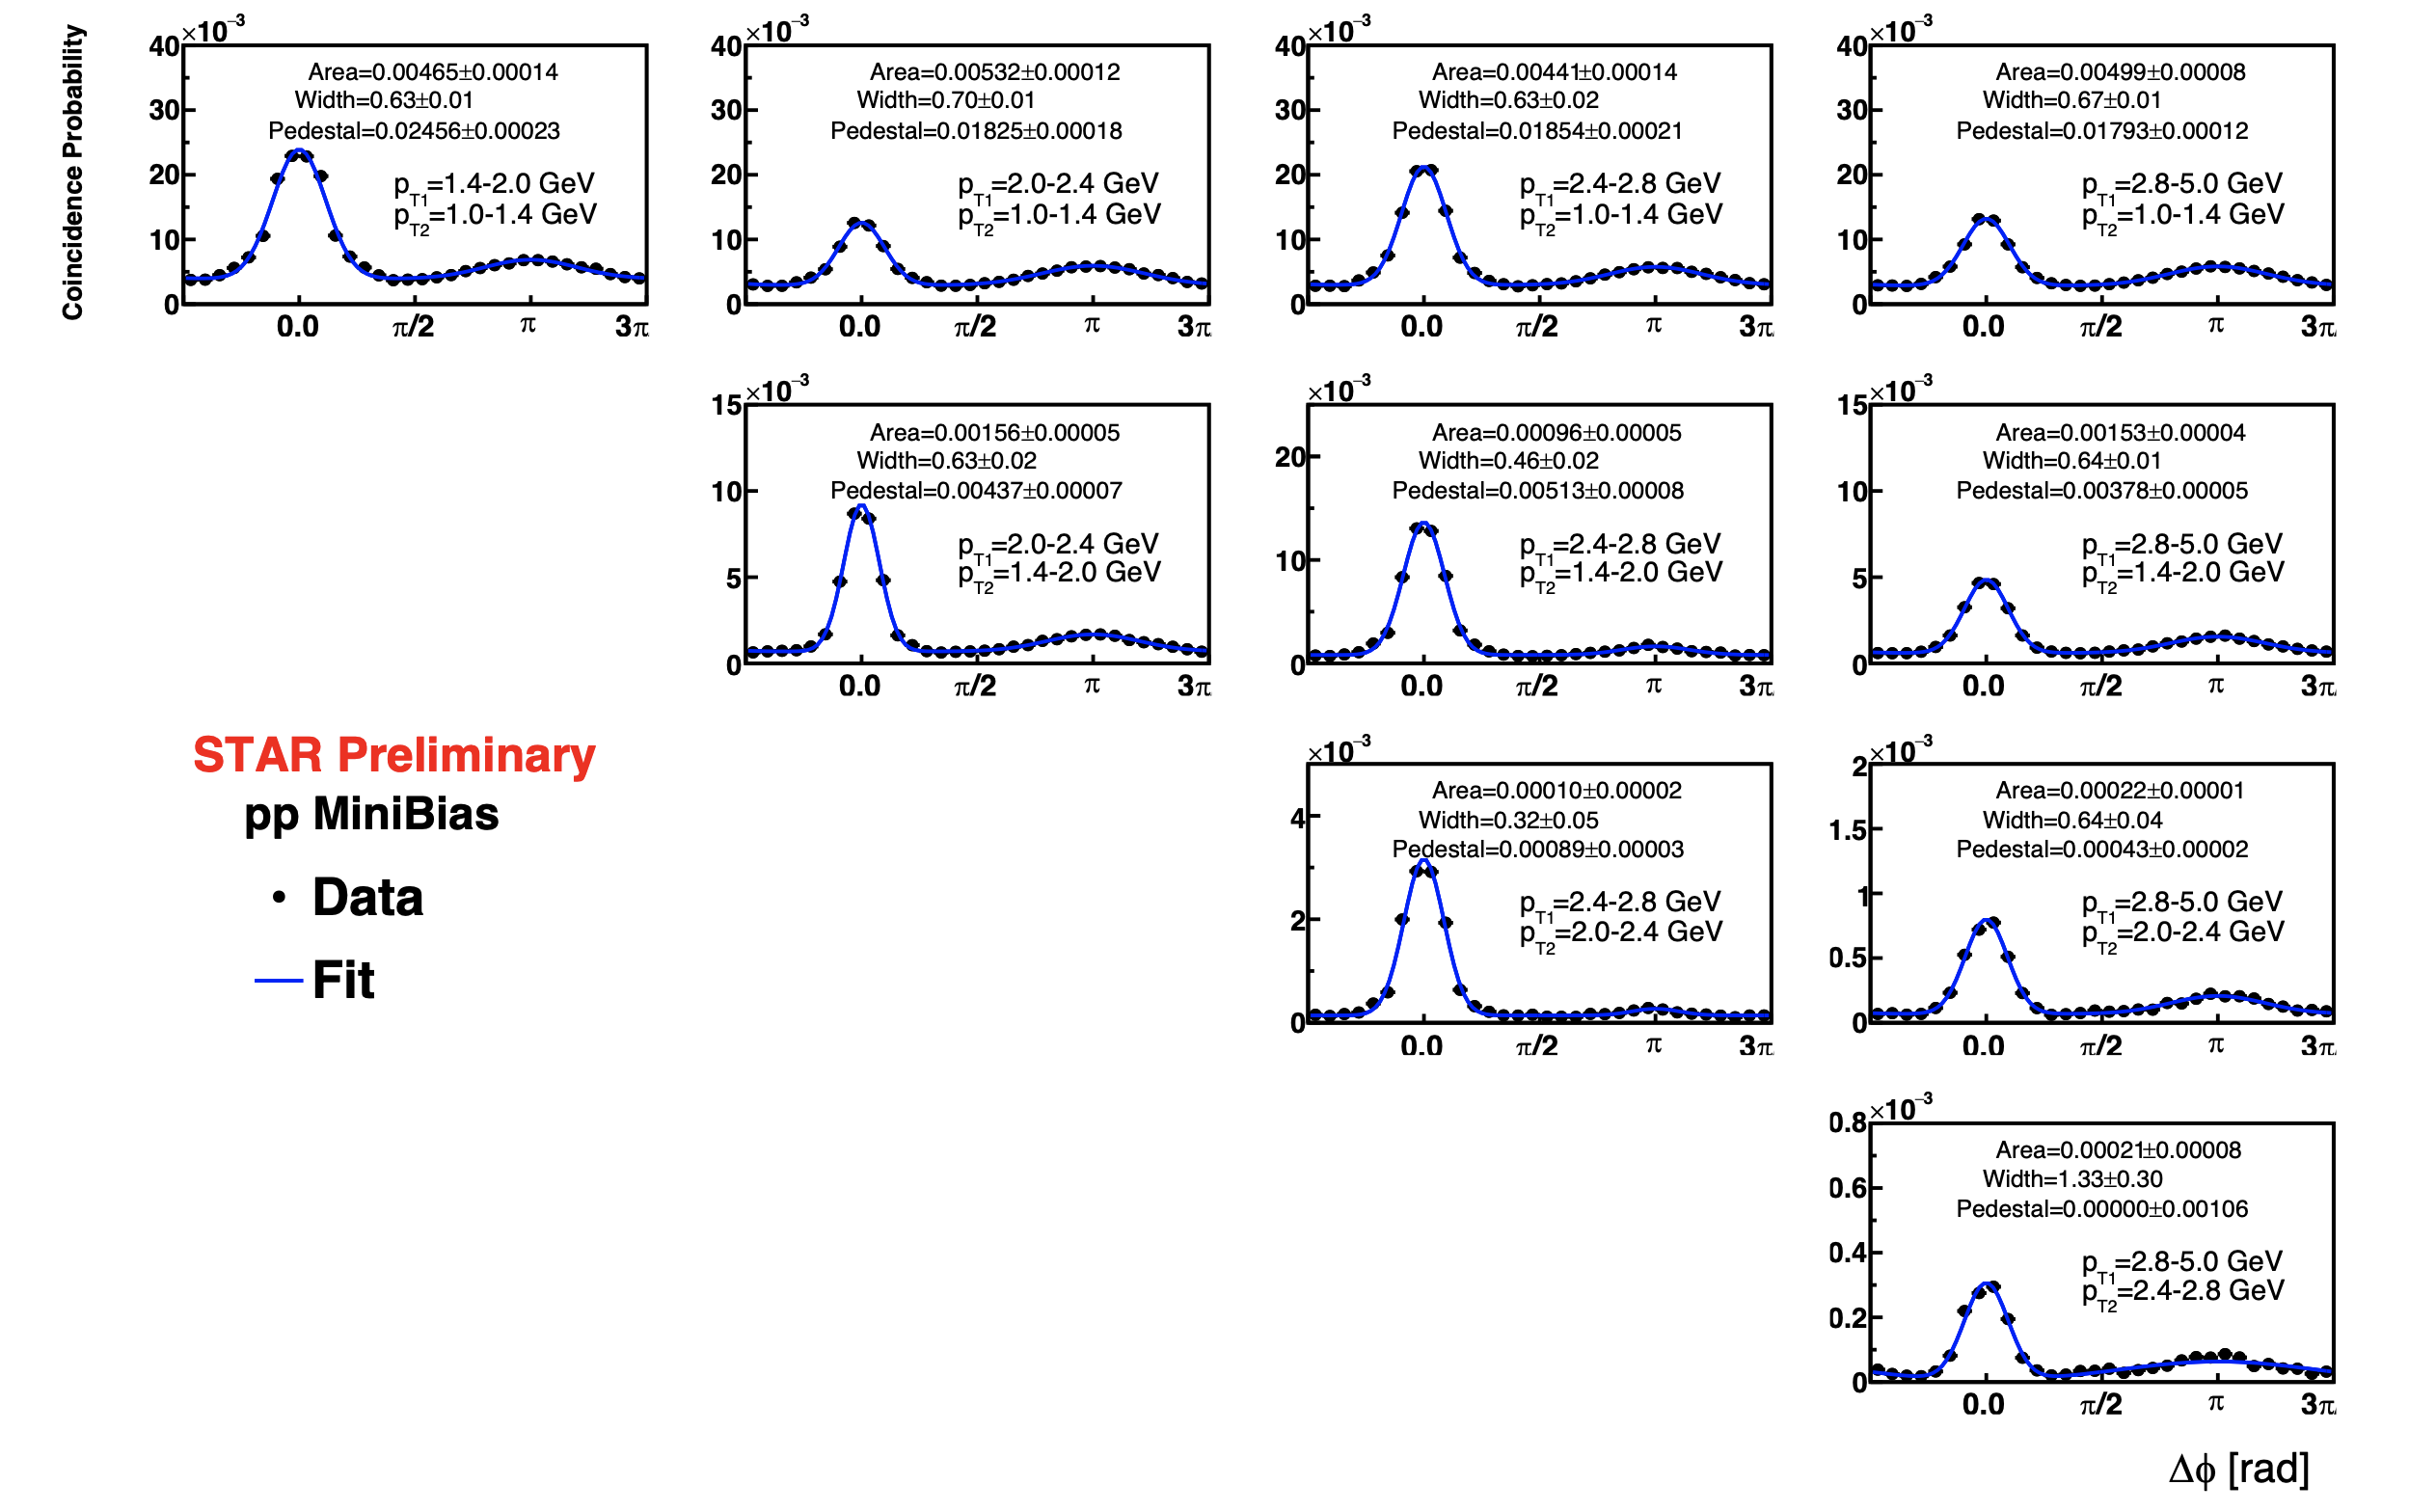
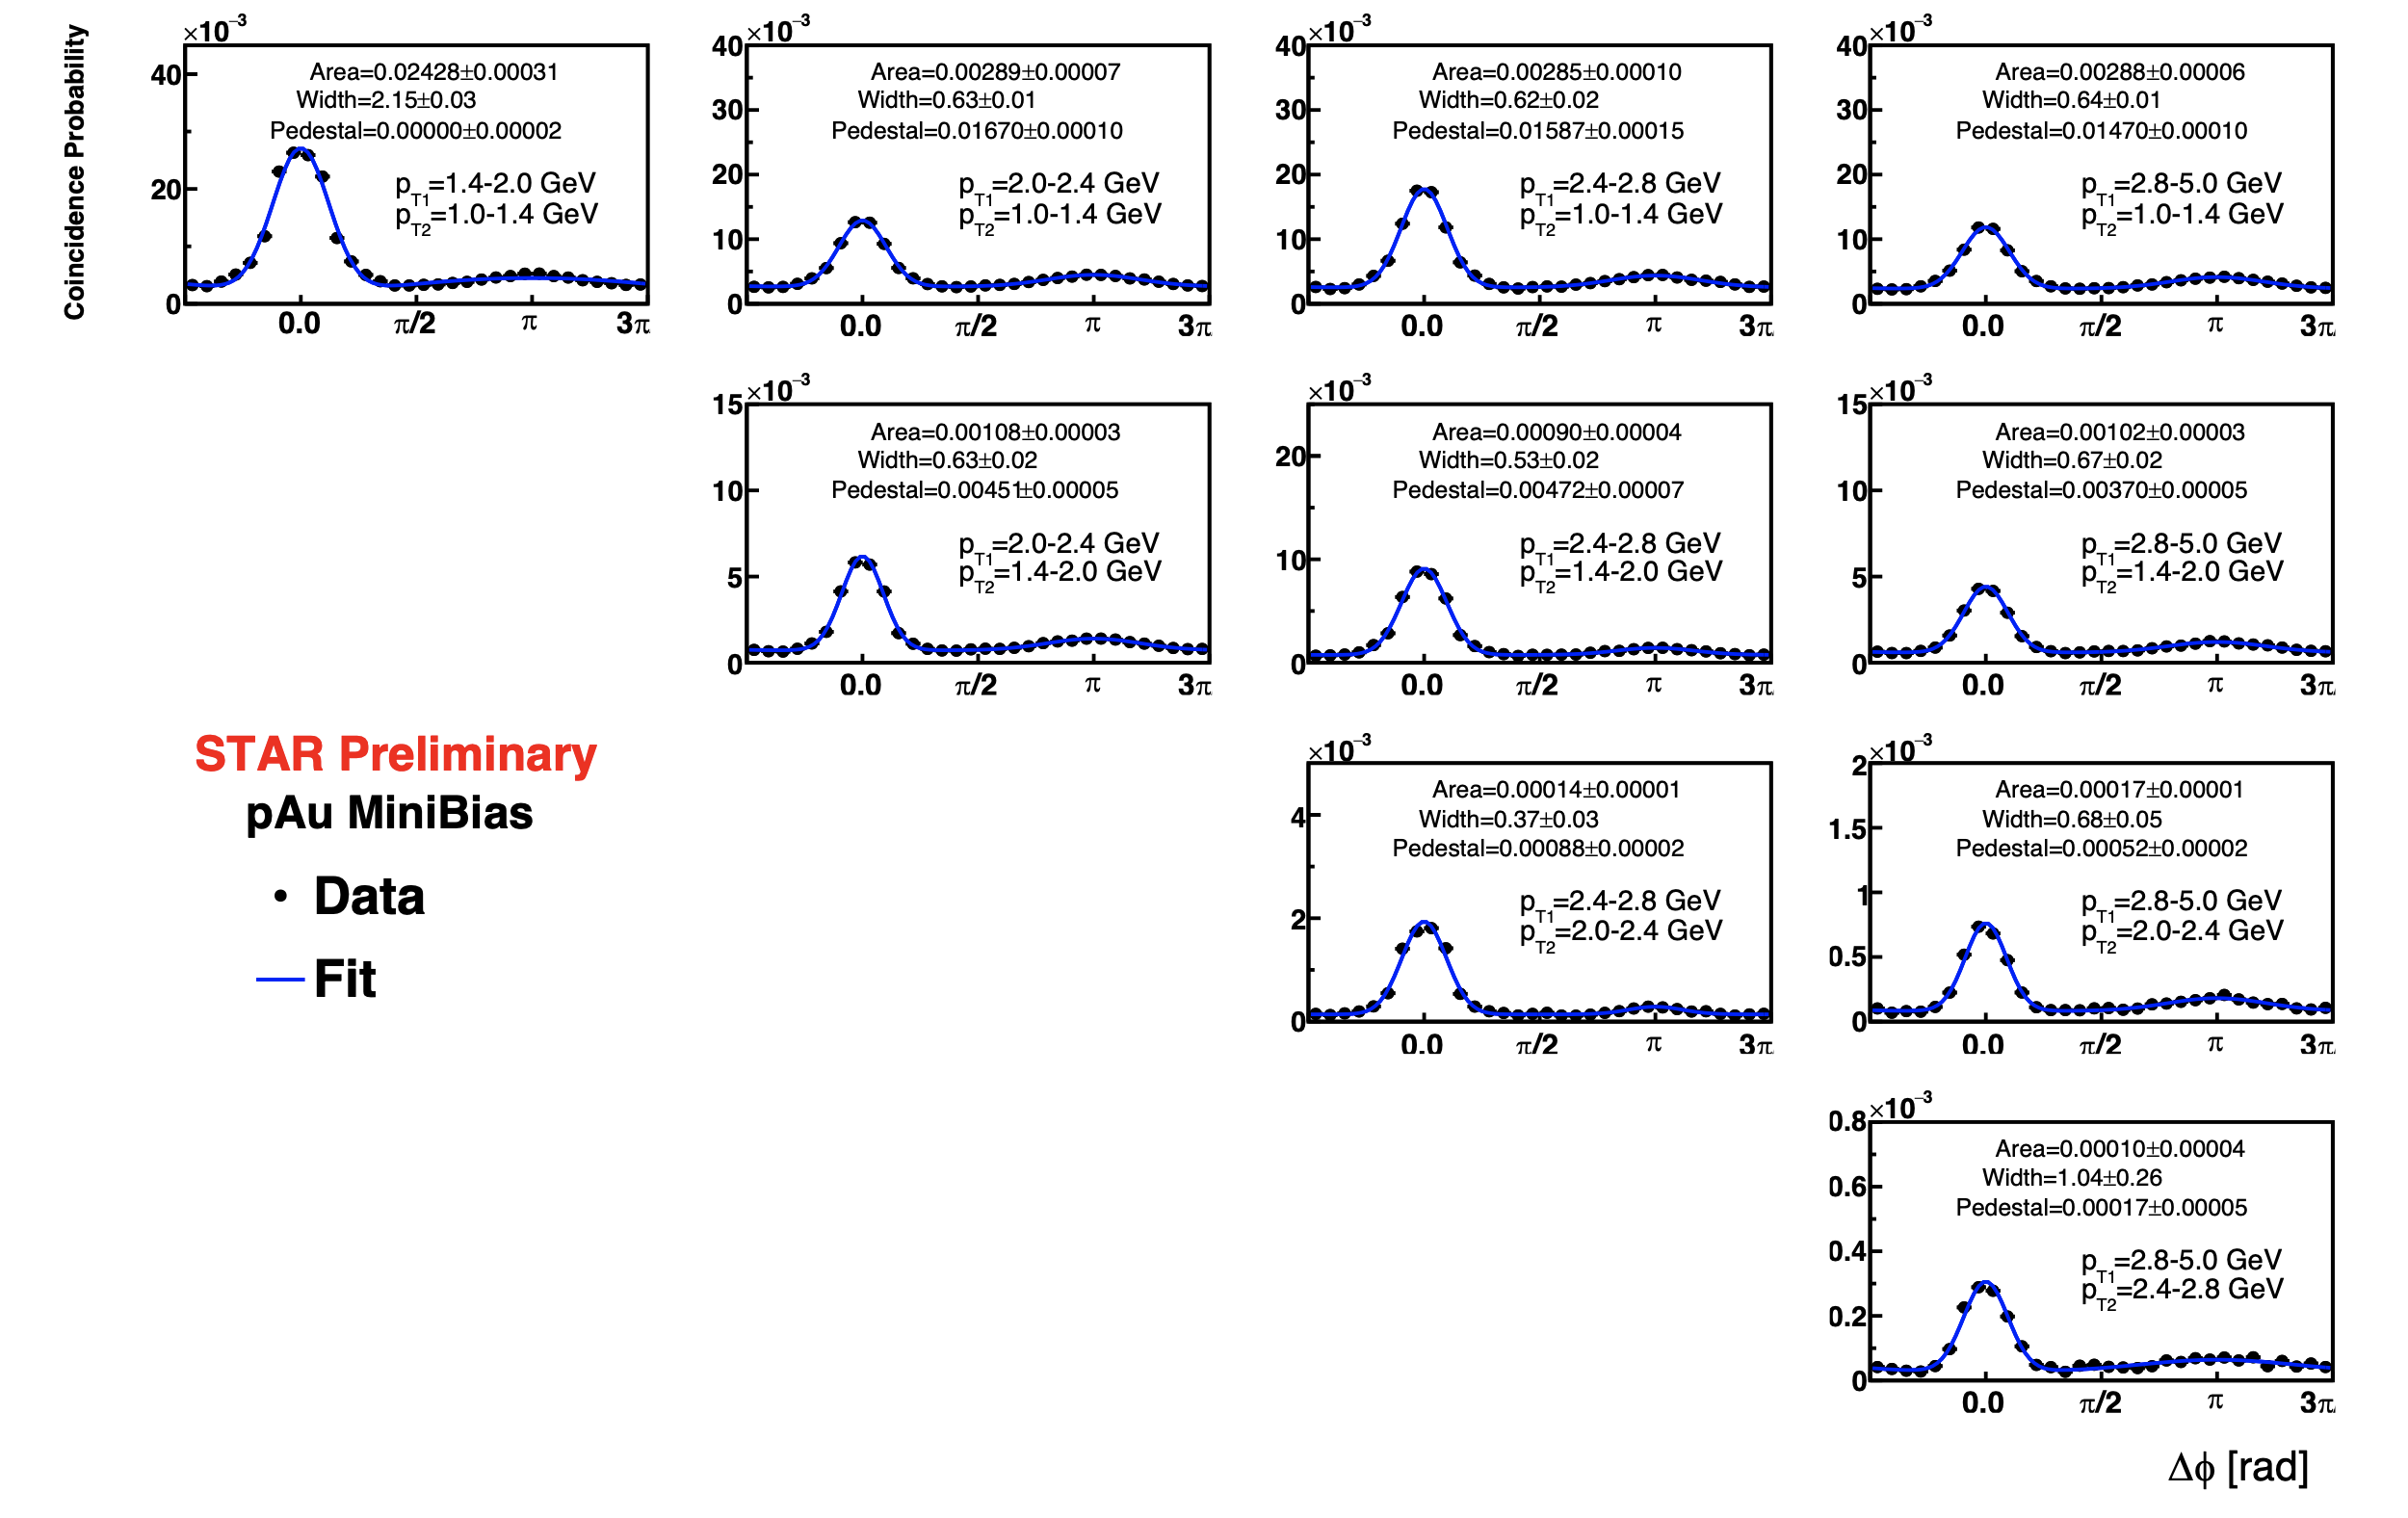
4. Correlation Vs ∆φ in MiniBias pp, MiniBias pAu and high BBCE pAu collisions.
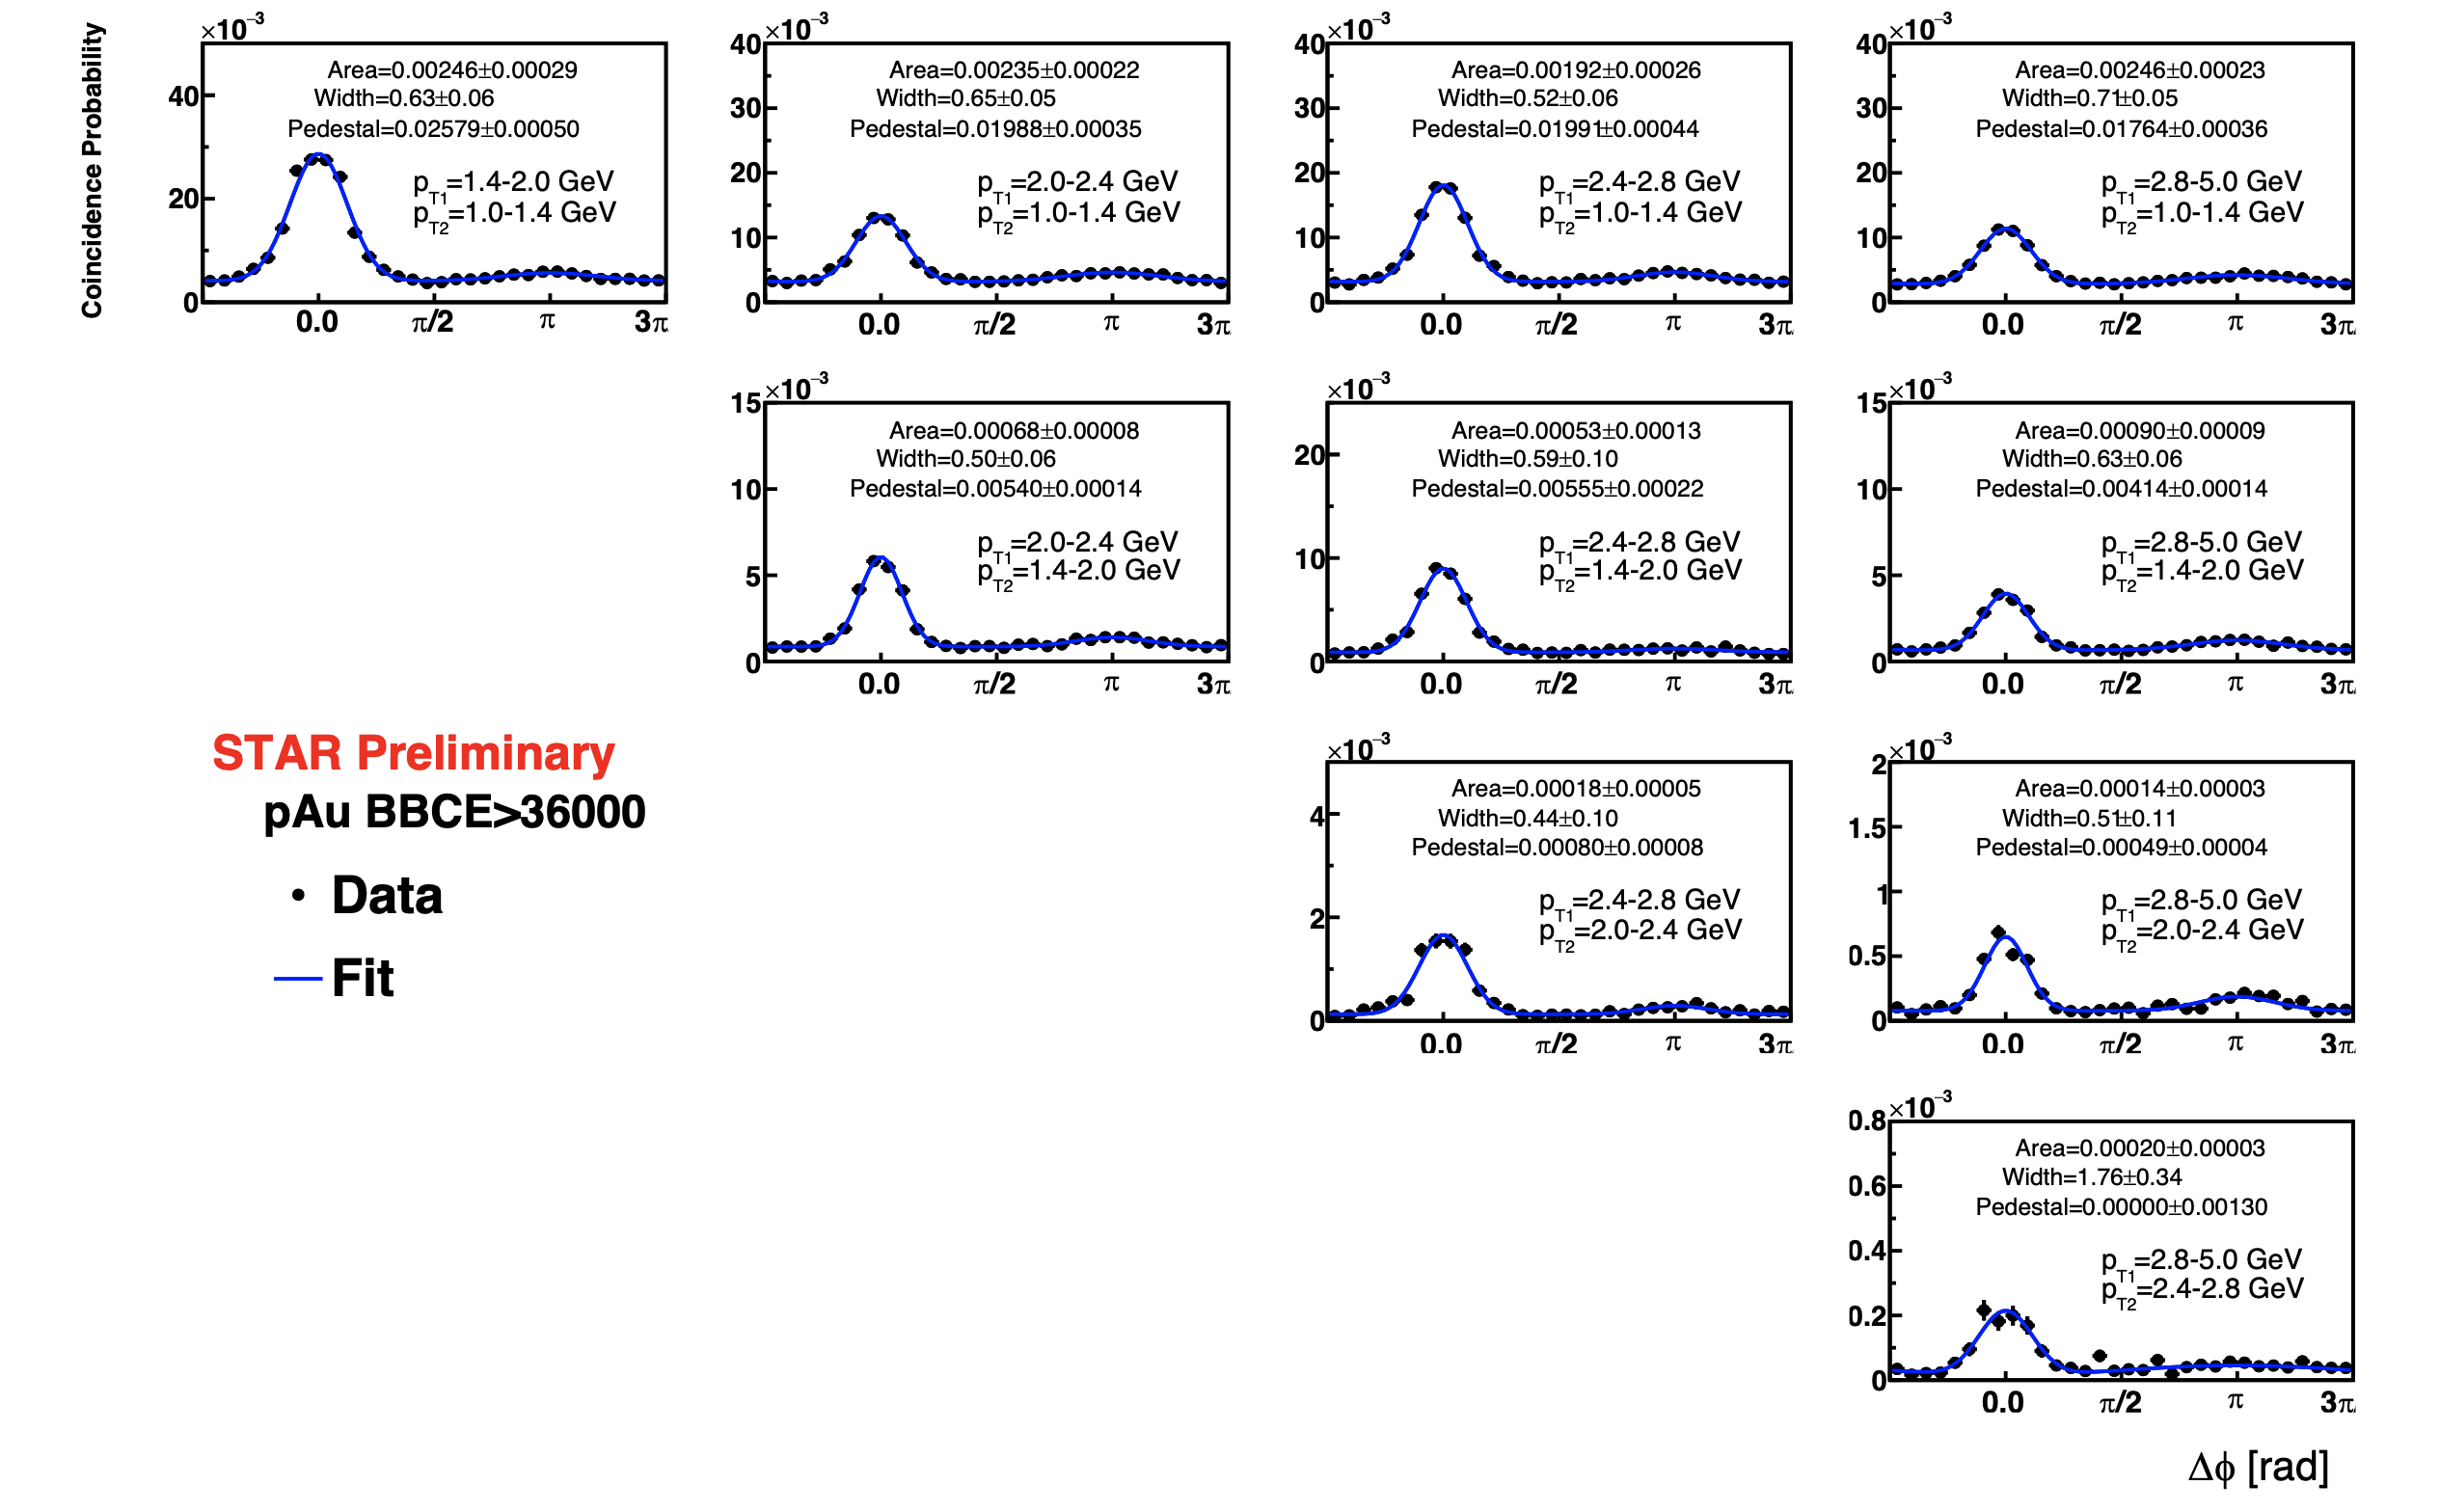
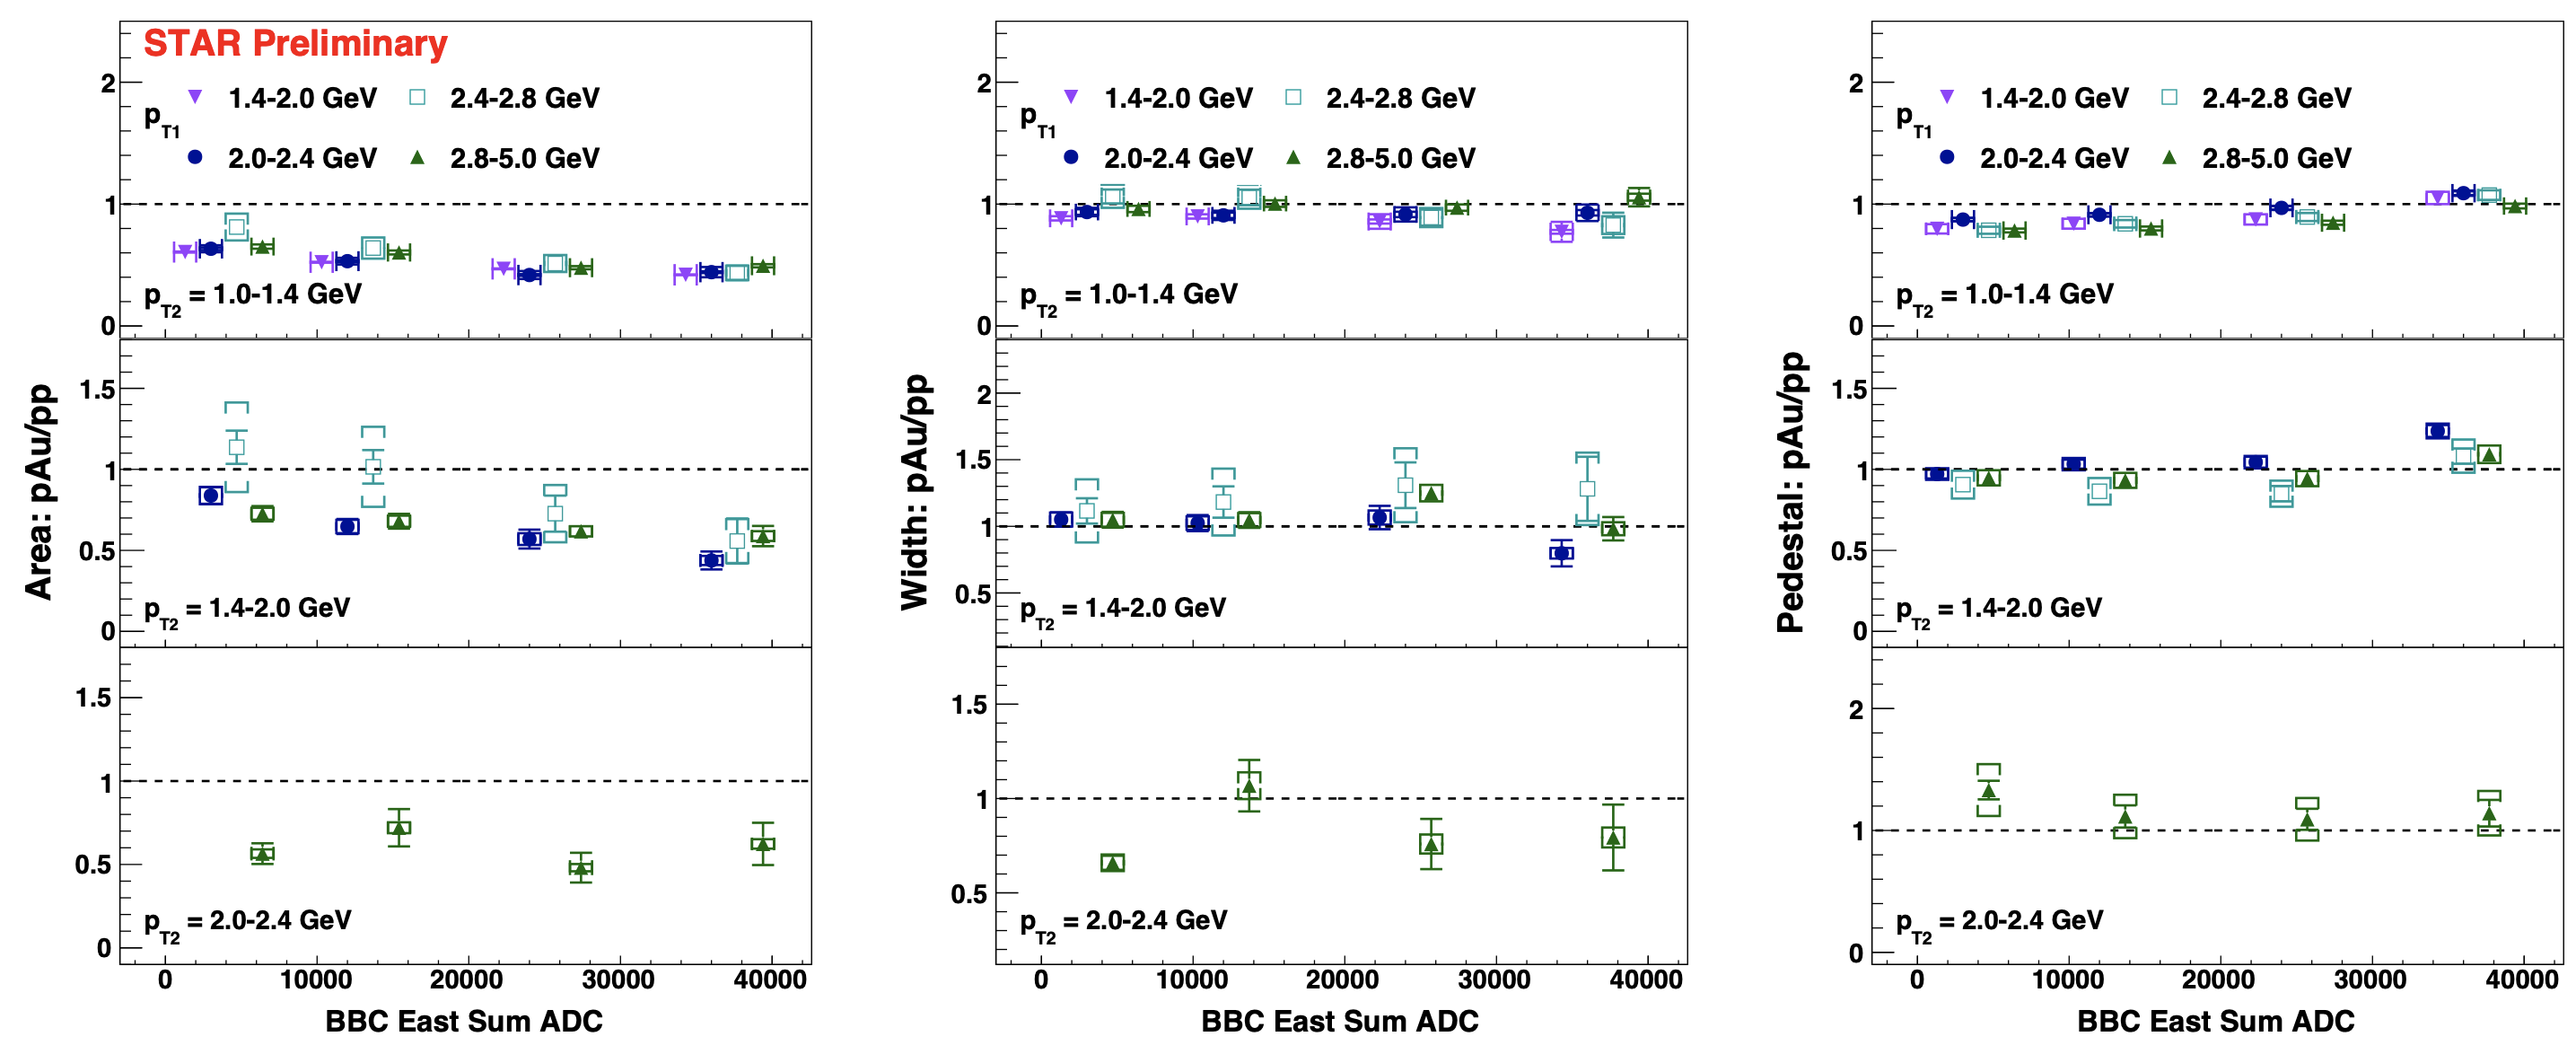
5. The ratio plots: away side peak Area, Width and Pedestal in pAu divided by those in pp Vs BBCE in pAu collisions. The plots are shown with/without theory predictions for the area ratio. The reference for rcBK is Phys. Rev. D 99, 014002.
.png)
6. The ratio plot: away side peak Area, Width and Pedestal in MiniBias pAu divided by MiniBias pp.
.png)
.png)
Plots for pp, pAu and pAl:
1. Correlation Vs ∆φ: MiniBias pp, pAu and pAl comparison in two example pT ranges. The A dependence of the suppression is observed in low pT. The suppression is weaker in high pT. The reference for GBW model is Phys. Lett. B 716, 430 (2012), 1109.1817.
.png)
2. Event activity dependence in pAu and pAl collisions:
.png)
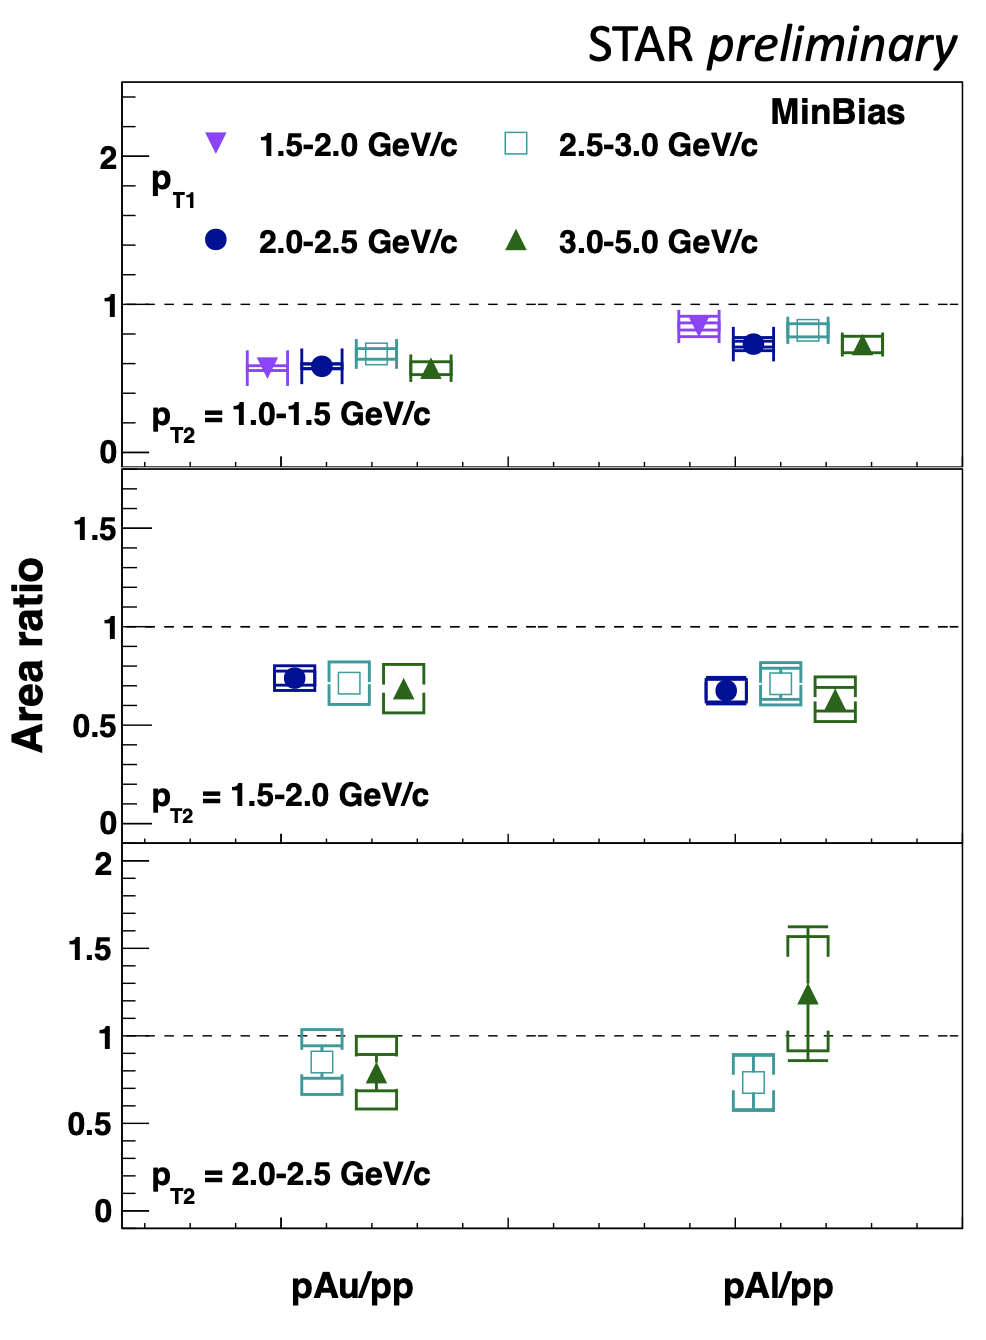
3. Area ratio for MinBias pAu/pp and pAl/pp:
Summary:
1. Dataset
This analysis uses STAR 2015 pp and pAu data. We used st_fms stream and six fms triggers (bsSm1-bsSm3, bsLg1-bsLg3). List of runs can be found in attached.
2. Selection
- Event level cuts: Exclude abort gap, BBC multiplicity > 0, TOF multiplicity > 2. Additional cut in first period of pAu (before run 16141009) bsSm3 trigger is excluded.
- Cuts on photons: E > 1GeV, pT> 0.1GeV.
- Cuts on pair of photons (pi0): Zgg < 0.7, ON Mass : 0.07 < mass < 0.2GeV. All pT_pair > 0.5GeV, in each trigger, pT of the trigger π0 should be greater than the threshold. bsSm1 and bsLg1: trigger pT_pair > 1.4 GeV, bsSm2 and bsLg2: trigger pT_pair > 2.0 GeV, bsSm3: trigger pT_pair > 2.4 GeV, bsLg3: trigger pT_pair > 2.8 GeV.
3. Mixed event correction method
- Take φ1 and φ2 distributions from the data for a certain pT1 and pT2 bin.
- Take a bin1 from φ1 (trigger π0, with bin content = N_bin1) and bin2 from φ2 (associate π0, with bin content = N_bin2).
- Fill "MIX" histogram at ∆φ = bin1 - bin2 (bin centers) with weight of N_bin1 * N_bin2.
- Repeat it for all combination between φ1 bins and φ2 bins.
- Subtract DPHI histogram from MIX histogram to remove "real" correlation contribution.
- Normalize "MIX" histogram by NBin/Integral.
- Divide Uncorrected DPHI histogram by "MIX" histogram, to get "corrected" DPHI.
Presentations:
Spin PWG summary of pp: https://drupal.star.bnl.gov/STAR/system/files/dipi0_0701.pdf
Spin PWG summary of the first period of pAu: https://drupal.star.bnl.gov/STAR/system/files/dipi0_0708.pdf
Spin PWG summary of the second period of pAu: https://drupal.star.bnl.gov/STAR/system/files/dipi0_071120.pdf
»
- xchu's blog
- Login or register to post comments