- xchu's home page
- Posts
- 2024
- October (1)
- 2023
- 2022
- 2021
- December (2)
- November (1)
- October (1)
- September (1)
- August (2)
- July (1)
- June (3)
- May (2)
- April (3)
- March (1)
- 2020
- October (2)
- September (1)
- August (5)
- July (1)
- June (3)
- May (3)
- April (1)
- March (2)
- February (4)
- January (1)
- 2019
- My blog
- Post new blog entry
- All blogs
Forward-dipi0-correlation-paper
Updated on Tue, 2022-08-09 12:41. Originally created by xchu on 2021-06-24 13:27.
Title: Evidence for Nonlinear Gluon Effects in QCD and their Mass Number Dependence at STAR
PAs: Xiaoxuan Chu, Elke-Caroline Aschenauer, Akio Ogawa, Zhengqiao Zhang
Intended journal: PRL
Abstract:
The STAR Collaboration reports measurements of back-to-back azimuthal correlations of di-$\pi^0$s produced at forward pseudorapidities ($2.6<\eta<4.0$) in $p$+$p$, $p+$Al, and $p+$Au collisions at a center-of-mass energy of 200 GeV. We observe a clear suppression of the correlated yields of back-to-back $\pi^0$ pairs in $p+$Al and $p+$Au collisions compared to the $p$+$p$ data. The observed suppression of back-to-back pairs as a function of event activity and transverse momentum suggests nonlinear gluon dynamics arising at high parton densities. The larger suppression found in $p+$Au relative to $p+$Al collisions exhibits a dependence of the saturation scale, $Q_s^2$, on the mass number, $A$. The suppression in high-activity $p+$Au collisions is consistent with theoretical predictions including gluon saturation effects.
Conclusion:
(1) A clear suppression of back-to-back di-π0 yields is observed in p+A in comparison with the reference p+p collisions at low pT
(2) The suppression is enhanced with higher event activity and for pairs probing smaller x (and Q2) with lower di-π0’s pT
(3) The measured suppression in high activity p+Au collisions is consistent with predictions calculated from gluon saturation model
(4) The presented results are the first measurement of the nuclear effect dependence on A and confirms the suppression is enhanced with higher A and is dependent with A^{1/3}
(5) The stable pedestal in p+A with p+p collisions provides opportunities to understand the suppression in d+A collisions
(6) No increase in the width of the azimuthal correlation is shown within experimental uncertainties
Figures:
Figure1:
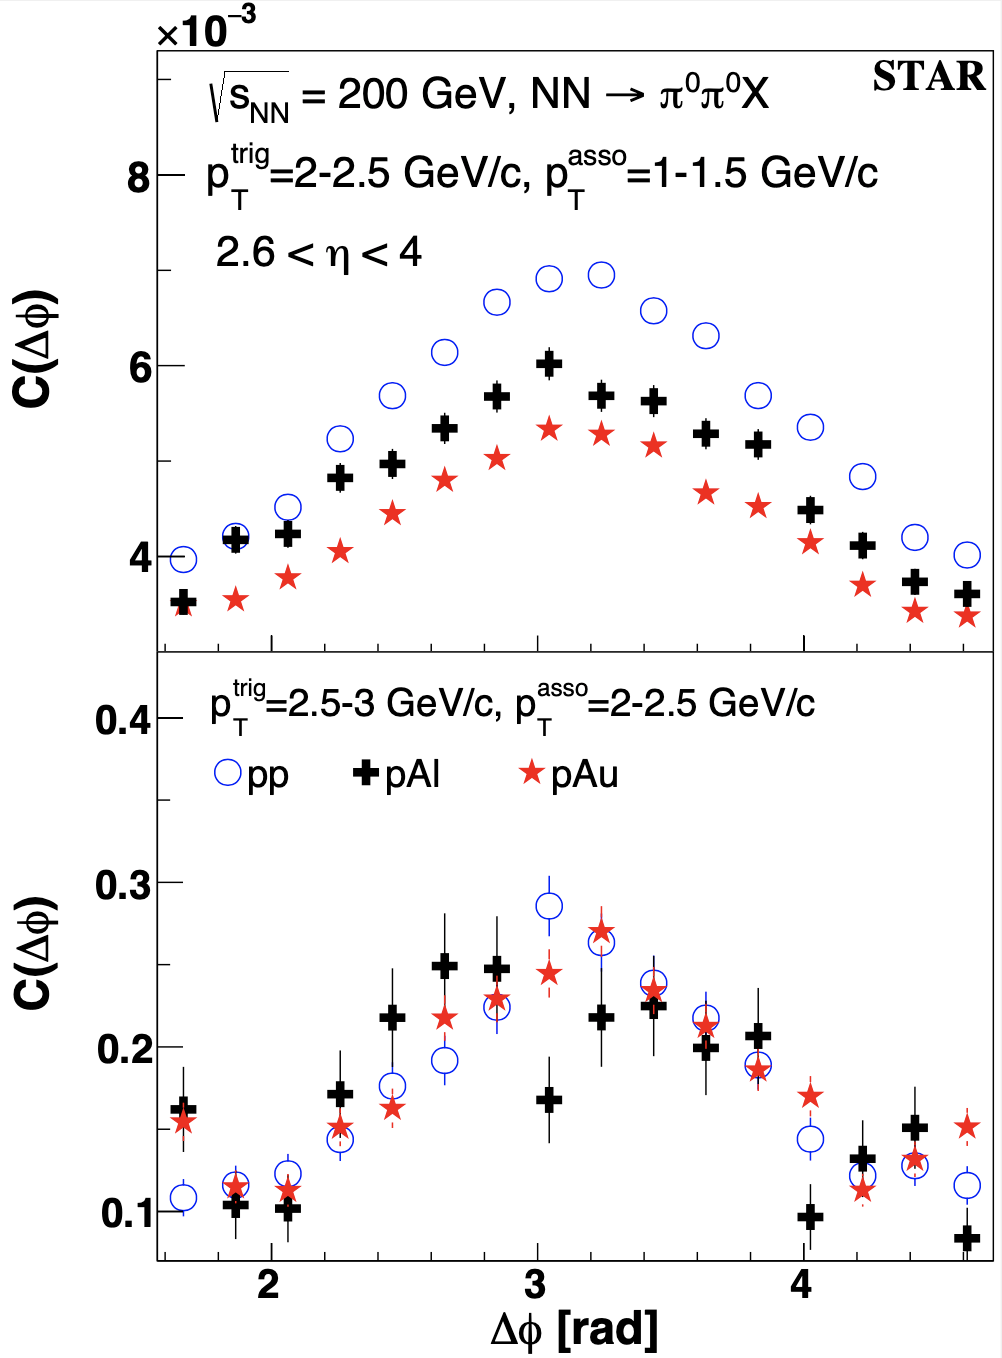
Figure1: Comparison of the correlation functions vs azimuthal angle between forward ($2.6<\eta<4.0$) back-to-back $\pi^0$ pairs in MinBias $p$+$p$, $p+$Al and $p+$Au collisions at $\sqrt{s_{\mathrm{NN}}}=200$ GeV. Upper panel: the trigger $\pi^0$'s $p_{T}$ ($p^{\mathrm{trig}}_T$) = 2-2.5 GeV/c, the associated $\pi^0$'s $p_{T}$ (p^{\mathrm{asso}}_T$) = 1-1.5 GeV/c; bottom panel: p^{\mathrm{trig}}_T$ = 2.5-3 GeV/c and $p^{\mathrm{asso}}_T$ = 2-2.5 GeV/c.
Figure2:
.png)
Figure2: Relative area of back-to-back di-$\pi^0$ correlation at forward rapidities ($2.6<\eta<4.0$) for different event activities (E.A.) in $p+$Au relative to MinBias $p$+$p$ collisions in different $p_{T}$ combinations: $p_{T}^{\mathrm{trig}}$ = 2.5-3 GeV/c; $p_{T}^{\mathrm{asso}}$ is from 1 to 2.5 GeV/c. Around each data point the vertical bars indicate the statistical uncertainties and the vertical bands indicate the point-to-point systematic uncertainties. The systematic uncertainties of the relative area at $p^{\mathrm{asso}}_T$ = 1-1.5 GeV/c, 1.5-2 GeV/c and 2-2.5 GeV/c are around 5.4\%, 15.1\% and 21.8\%, respectively. The corresponding systematic uncertainties of the width are 0.06\%, 5.2\% and 15.6\%. The measured relative area for the highest E.A. is compared with theory predictions based on the rcBK model \protect\cite{Albacete:2018ruq} at an impact parameter $b = 0$. Data points for the lowest E.A. are shifted to avoid overlap.
Figure3:
.png)
Figure3: Relative area of of back-to-back di-$\pi^0$ correlation at forward rapidities ($2.6<\eta<4.0$) for different event activity $p+$Al and $p+$Au bins relative to MinBias $p$+$p$ collisions at $p^{\mathrm{trig}}_{T}$ = 1.5-2 GeV/c and $p^{\mathrm{asso}}_{T}$ = 1-1.5 GeV/c. Around each data point the vertical bars indicate statistical uncertainties and the vertical bands indicate point-to-point systematic uncertainties. The systematic uncertainty of the relative area is around 2.8\%.
Figure 4:
.png)
Figure4: Relative area of of back-to-back di-$\pi^0$ correlation at forward rapidities ($2.6<\eta<4.0$) in MinBias $p+$Au and $p+$Al relative to $p$+$p$ collisions at $p^{\mathrm{trig}}_{T}$ = 1.5-2 GeV/c and $p^{\mathrm{asso}}_{T}$ = 1-1.5 GeV/c. Around each data point the vertical bars indicate statistical uncertainties and the vertical bands indicate point-to-point systematic uncertainties. The systematic uncertainty of the relative area is around 2.8\%. The slope from linear fitting function is -0.09 $\pm$ 0.01.
Paper draft:
v1
v2
v3
v4.1: after CR review fordiff
v4.2: after CR review
v5
v6.1: after PRL review 1st round fordiff
v6.2: after PRL review 1st round
v7.1: after PRL review 2nd round fordiff
v7.2: after PRL review 2nd round
Analysis note:
v1
v2
v3
Analysis Code: /star/u/xchu/pwg/DiPion0Corr/psn0777
Paper proposal page:
https://drupal.star.bnl.gov/STAR/blog/xchu/dipi0-correlation-paper-proposal
Summary of PWGC preview:
https://drupal.star.bnl.gov/STAR/system/files/PWGC_preview_0.pdf
Summary of GPC review:
GPC_review.pdf
GPC_review_response.pdf
Summary of institute review:
CRW.pdf
»
- xchu's blog
- Login or register to post comments