- xuanli's home page
- Posts
- 2015
- 2014
- 2013
- December (4)
- November (2)
- October (6)
- September (4)
- August (6)
- July (4)
- June (4)
- May (4)
- April (3)
- March (15)
- February (6)
- January (5)
- 2012
- December (3)
- November (10)
- October (9)
- September (4)
- August (5)
- July (11)
- June (3)
- May (1)
- April (1)
- March (1)
- January (2)
- 2011
- December (3)
- October (4)
- September (3)
- August (3)
- July (2)
- June (6)
- May (13)
- April (7)
- March (10)
- February (2)
- January (1)
- 2010
- 2009
- My blog
- Post new blog entry
- All blogs
FMS triggered data simulaton comparation (previous simulation)
Comparation between FMS triggered data and simulation in p+p
(1) FMS Selections
1, in data, using FMS triggered data, selec at least one reconstructed pi0 in the FMS with pt > 2.0GeV/c.
2, in simulation, applying FMS acceptance cuts for pi0 decayed photons, and requiring the pi0 with pt > 2.0GeV/c.
(2) BBC requirement
East BBC charge sum non-zero and west BBC charge sum non-zero.
(3) Results
Using STAR library SL11b, and the tower threshold 250MeV.
1, EEMC
.gif)
Figure1, EEMC tower multiplicity shown in the left and tower energy (normalized by events) shown in the right above 250MeV.
.gif)
Figure2, EEMC zvertex distribution (left) and the single cluster energy (right).
2, BEMC
.gif)
Figure3, BEMC tower multiplicity shown in the left and tower energy (normalized by events) shown in the right above 250MeV.

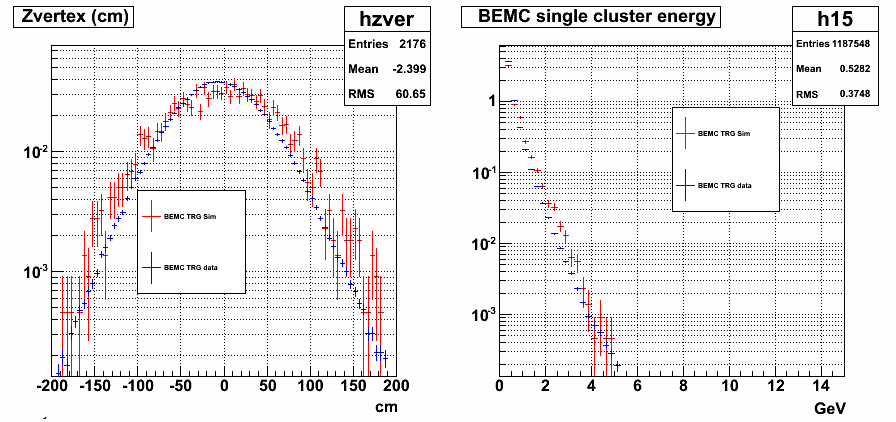
Figure4, BEMC zvertex distribution (left) and the single cluster energy (right).
Conclusion:
The simulation energy is larger than the data energy in BEMC and EEMC.
- xuanli's blog
- Login or register to post comments
