charm cross section from Run8 pp by TOF
Fit Run8 p+p NPE results (data points provided by Wei and Jin Fu) with Power-law D0 decays.
The fit results are below:
==================== Fit TOF Only ===================
<pt> = 1.04 +/- 0.07 +/- 0.10 (GeV/c)
n = 18.5 +/- 5.0 +/- 10.5
xsec = 1.05 +/- 0.07 +/- 0.28 (mb)
chi2/ndf = 22.98/19 (stat.), 3.77/19 (stat. + sys.)
================================================
========= Fit TOF+EMC with uncorrelated error ============
<pt> = 0.92 +/- 0.05 +/- 0.14 (GeV/c)
n = 11.5 +/- 2.0 +/- 5.5
xsec = 1.06 +/- 0.10 +/- 0.36 (mb)
chi2/ndf = 40.18/28 (stat.), 2.33/28 (stat. + sys.)
================================================
========== Fit TOF+EMC with correlated error ==============
<pt> = 0.92 +/- 0.05 +/- 0.08 (GeV/c)
n = 11.5 +/- 2.0 +/- 3.0
xsec = 1.07 +/- 0.10 +/- 0.30 (mb)
chi2/ndf = 40.18/28 (stat.), 8.53/28 (stat. + sys.)
================================================
========== Fit latest TOF+EMC with correlated error ==============
TOF data: http://portal.nersc.gov/project/star/jfazj/NPE/YIFEI_NPE_XS/NPE_XS_YIFEI.txt
EMC data: combined latest results of Run5 (Gang) and Run8 (Wei)
<pt> = 0.90 +/- 0.04 +/- 0.10 (GeV/c)
n = 10.5 +/- 1.0 +/- 2.0
xsec = 1.08 +/- 0.05 +/- 0.32 (mb)
chi2/ndf = 52.13/28 (stat.), 5.06/28 (stat. + sys.)
see Fig. 7 and 8
================================================
Fit plots and cross section vs Nbin are below:
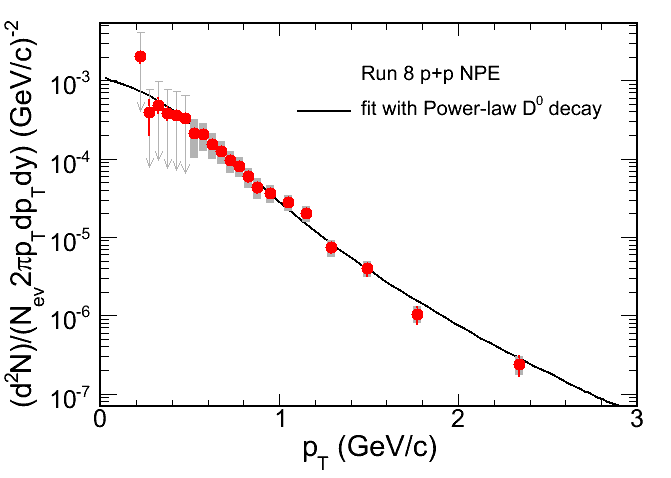
Fig. 1 Fit TOF NPE only with Power-law D0 decay.
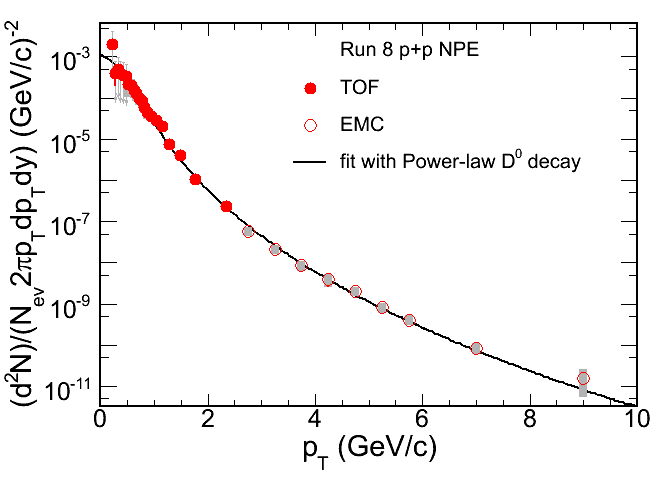
Fig. 2 Combined fit to TOF and EMC NPE with Power-law D0 decay.
.gif)
Fig. 3 Charm cross section as a function of Nbin.
p+p data point is from the combined fit to TOF and EMC NPE in Run8.
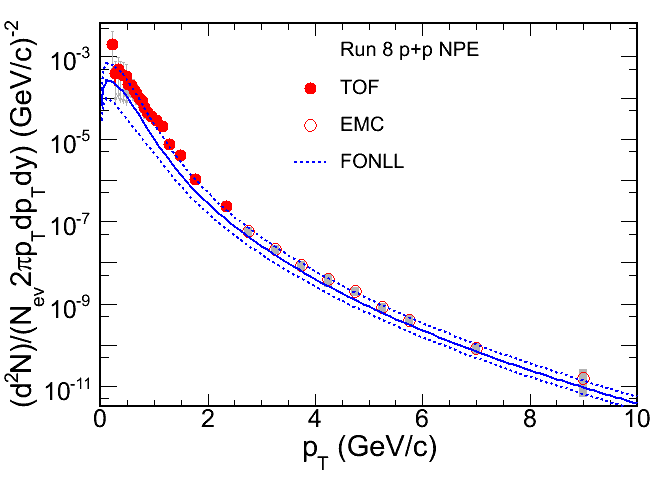
Fig. 4 pT spectra compared with FONLL calculation.
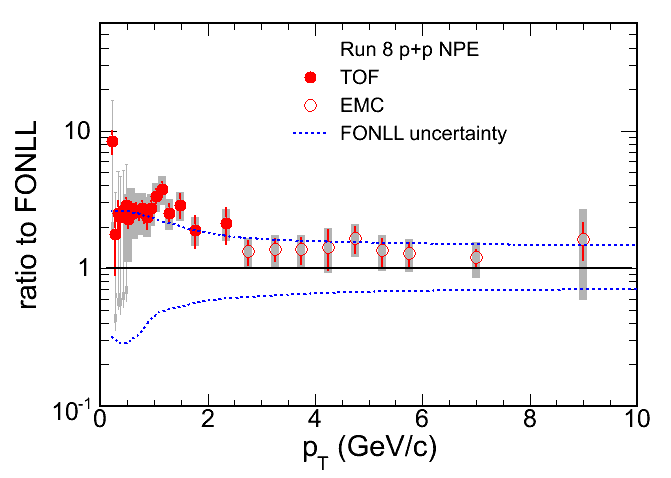
Fig. 5 Ratio to FONLL (Log Scale).
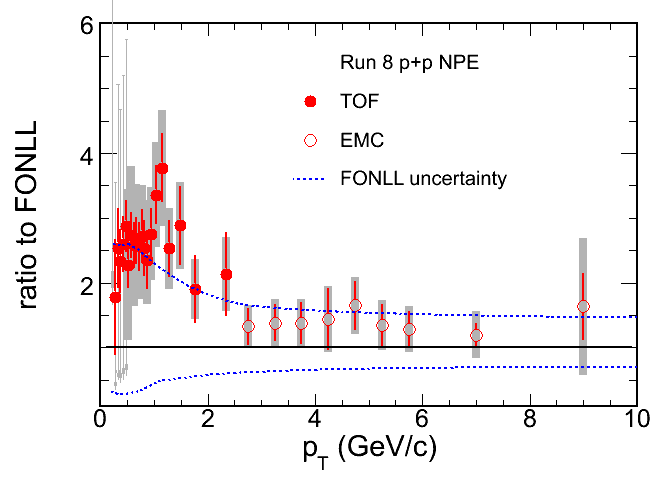
Fig. 5 Ratio to FONLL (Linear Scale).
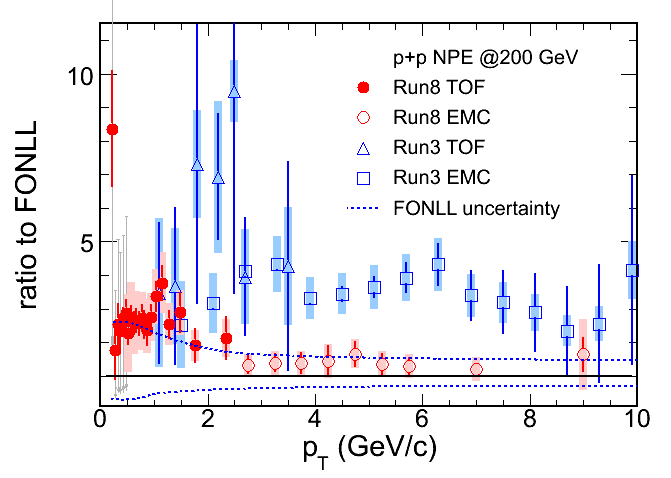
Fig. 6 Ratio to FONLL (Compare with Run 3).
.gif)
Fig. 7 Combined fit to latest TOF and EMC NPE with Power-law D0 decay.
.gif)
Fig. 8 Charm cross section as a function of Nbin.
p+p data point is from the combined fit to TOF and EMC NPE in Run8+5.
==================================================
Summary: The cross section constrained by low pT TOF data points.
The fit results with TOF only and with TOF+EMC are consistent.
high pT EMC data points constrain the spectrum shape (<pt>, n).
The systematic error in the cross section includes the bin-by-bin
stat. + sys. errors from spectrum and the overall normalization errors
(latest correlated sys. error: TOF 14%, EMC 4%).
The final result is consistent with previous measurements.
==================================================
- yfzhang's blog
- Login or register to post comments
