d+Au ridge: Charge Identification -- FTPC Eta Dependence
This page is documentary purpose.
Motivation:
FTPC charge identification ability dependence on η acceptance. It was shown in Frank Simon's thesis from simulation:
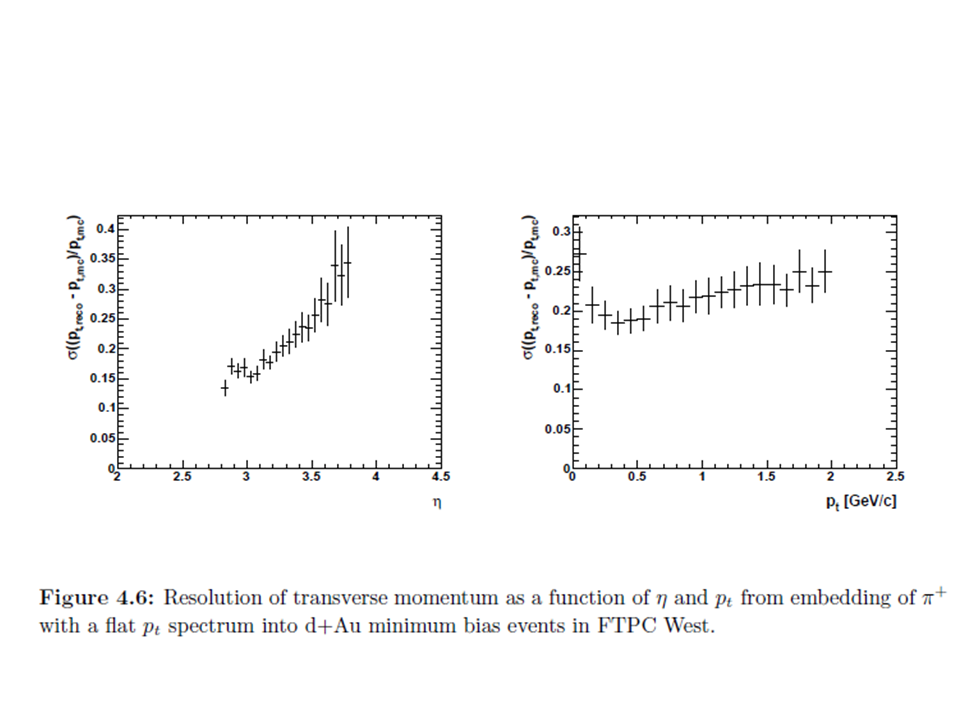
The FTPC charge resolution goes worse as η increases from the left plot.
As Saskia Mioduszewski suggested, the effect should go stronger if the correlation only be washed out by the poor resolution. So we will compare small FTPC η and the wider one.
Method:
pT and η dependence for dihadron correlation for d+Au Ridge study.
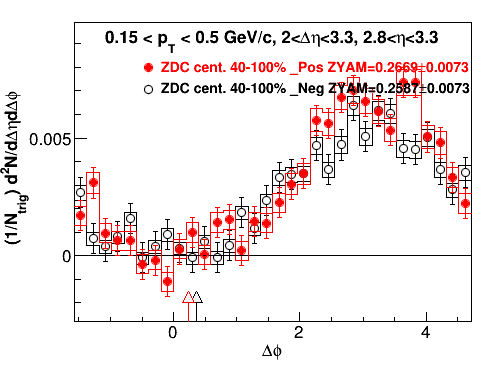
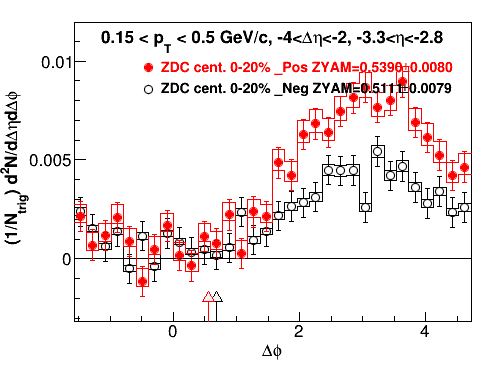
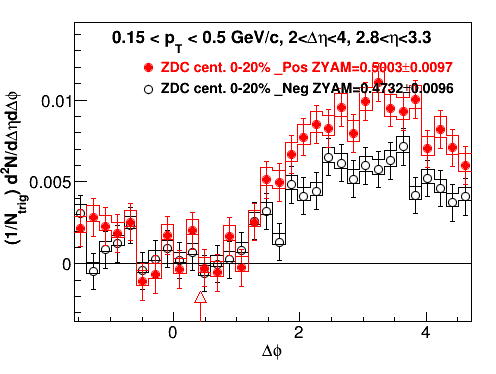
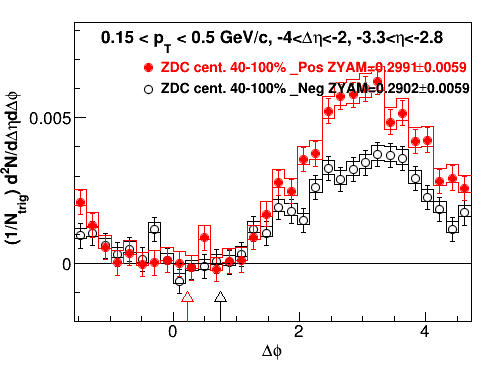
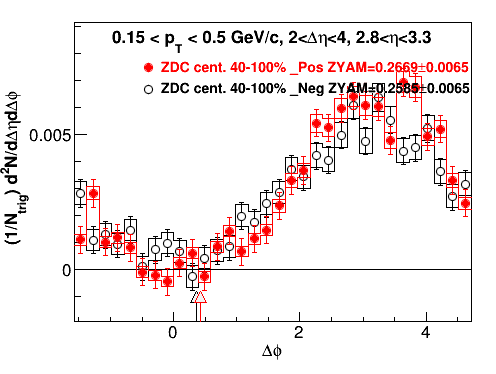
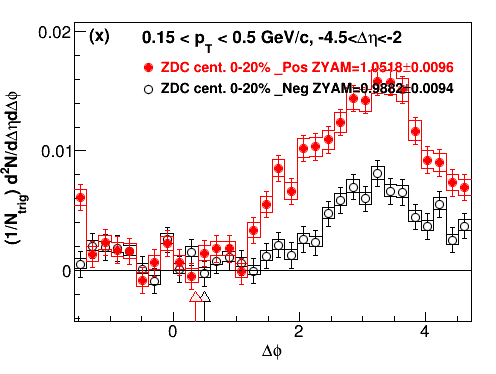
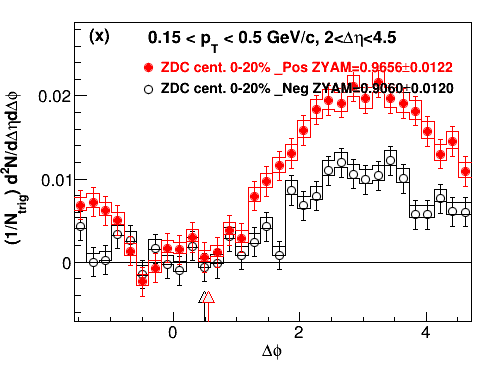
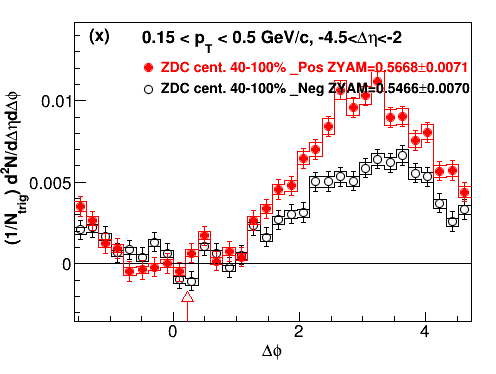
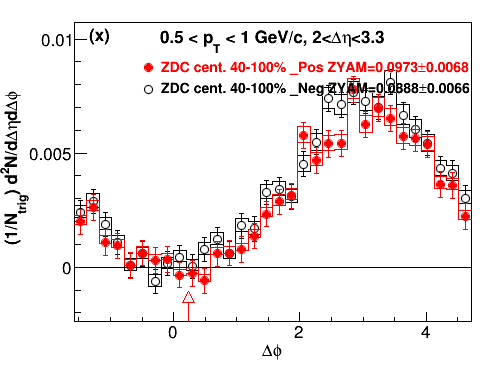
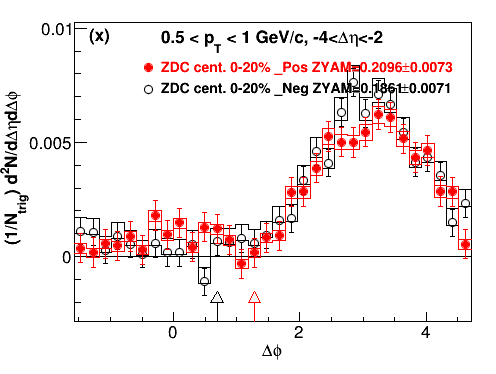
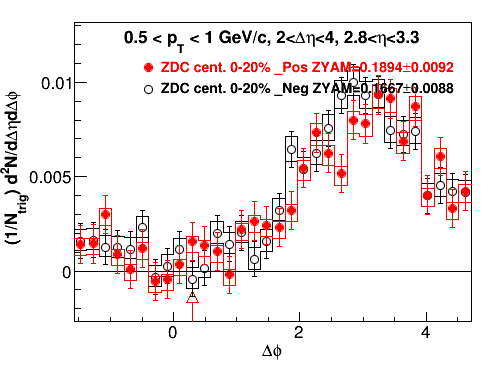
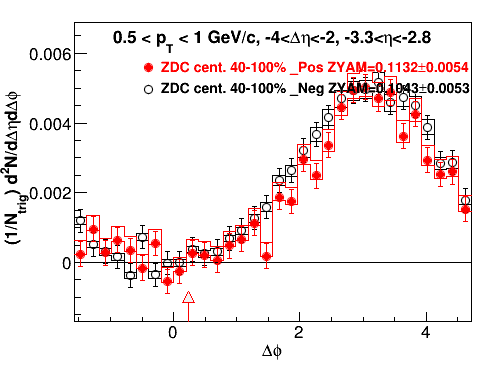
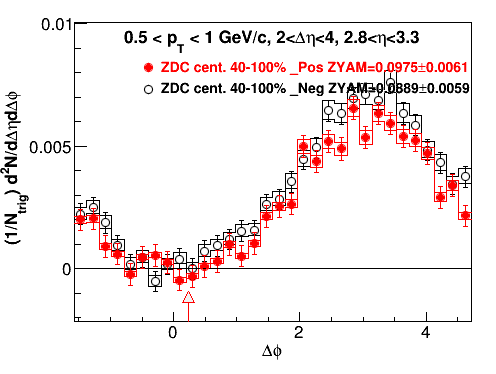
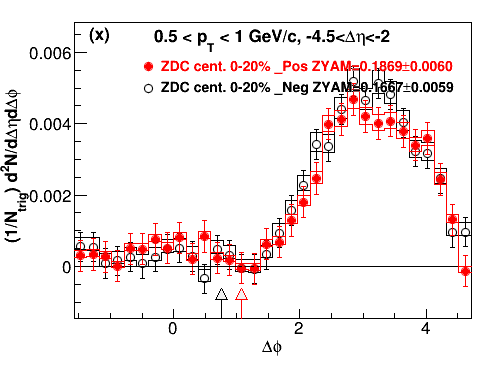
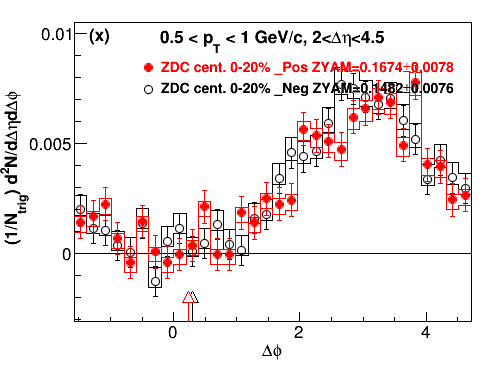
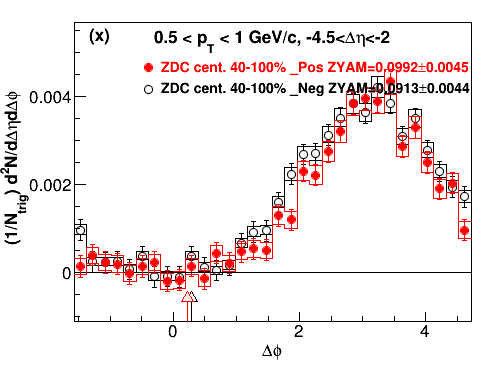
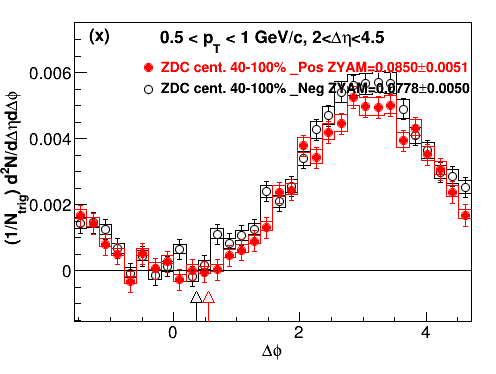
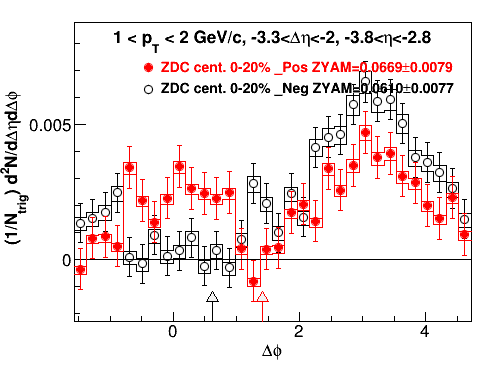
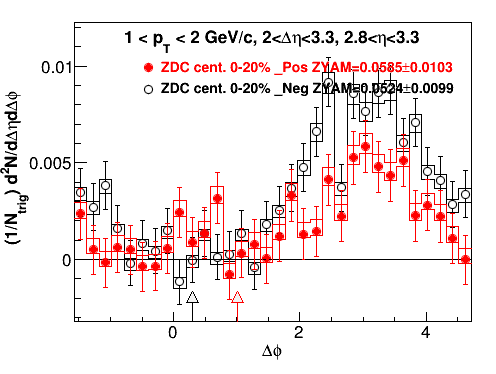
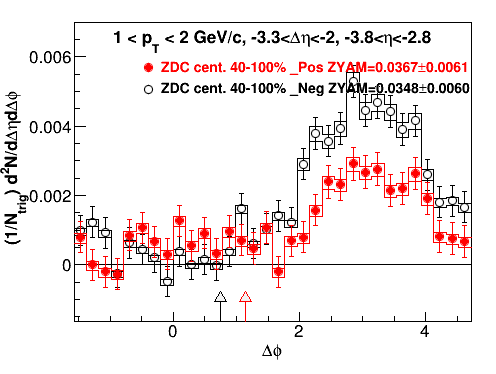
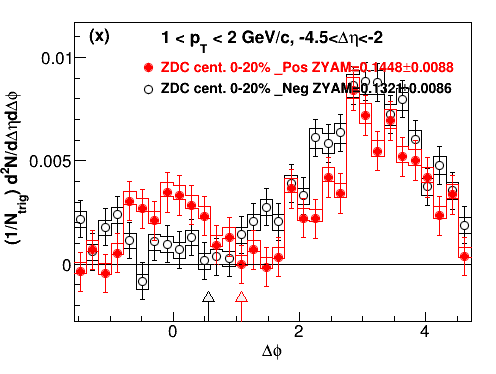
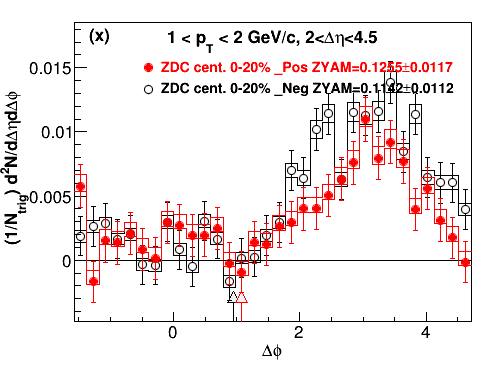
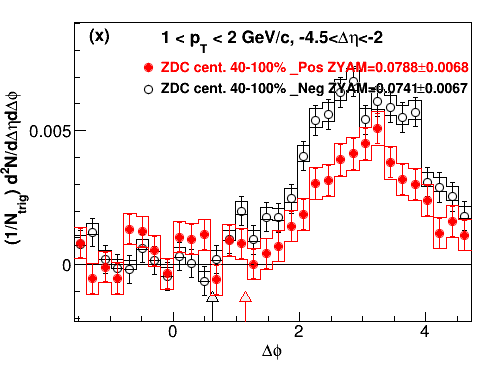
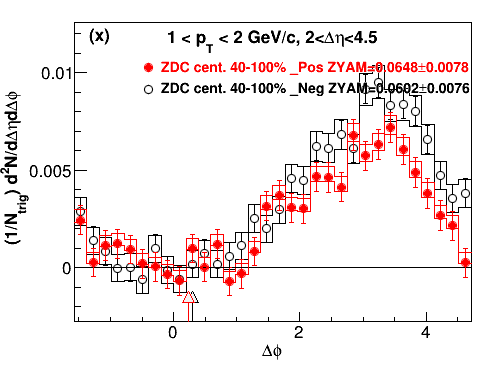
Trigger particle in TPC. Associate particle in FTPC. The positive vs negative charge associate particle. The dihadron correlation below shown is ZYAM substracted.
Data set:
Run3
|Vz| < 50 cm
primary track for both TPC and FTPC
nHitsFit > 25 points for TPC, 5 points for FTPC
nHitsFit/nHitsPoss >= 51%
globa dca < 3 cm
|eta|<1 for TPC, 2.8<|eta|<3.8 for FTPC
Results:
Instruction on how the figures organized:
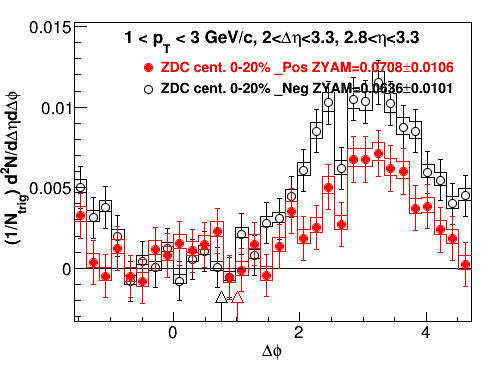
Each table is one pT pair. Here trigger and associated particle use the same pT bins.
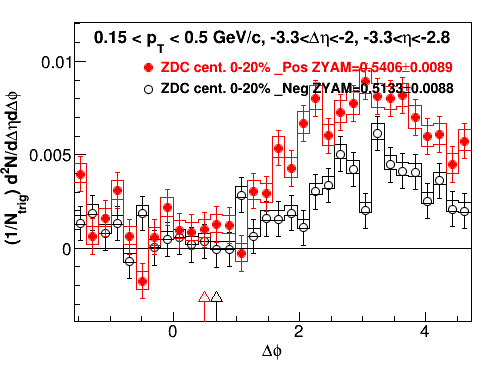
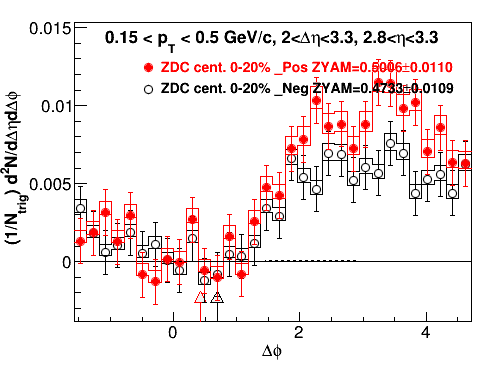
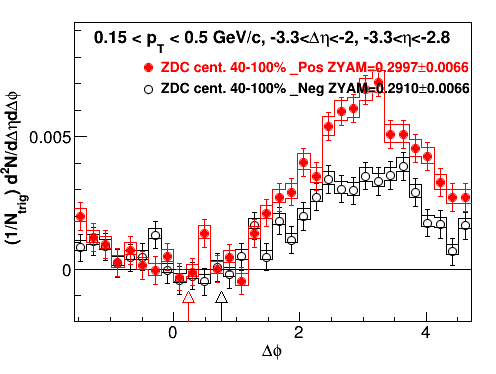
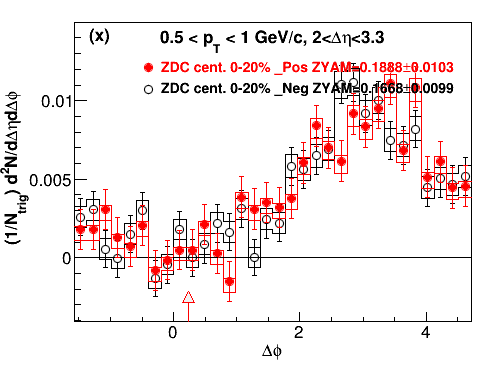
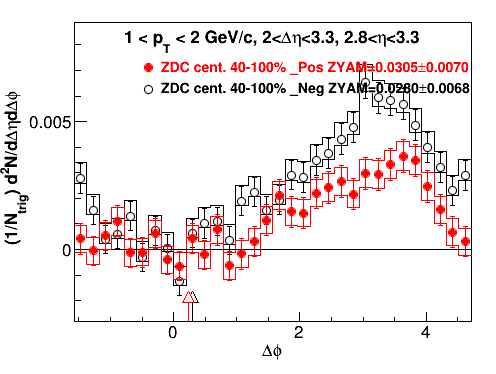
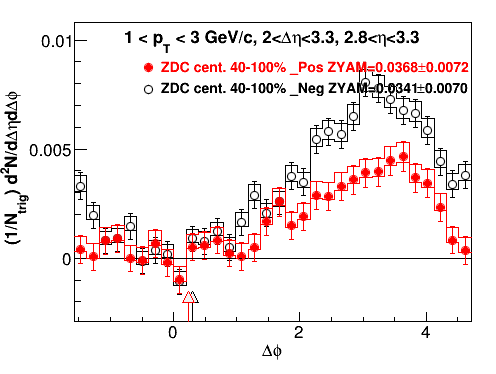
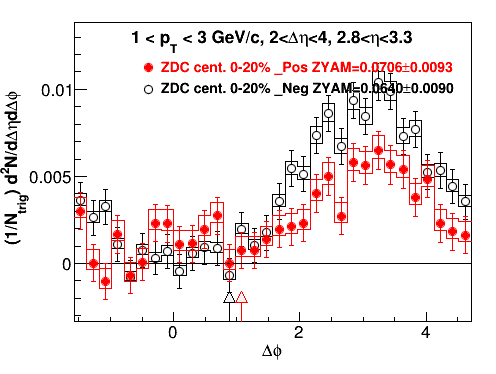
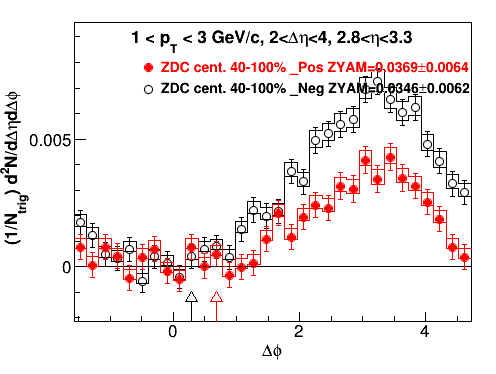
The first row: 2<|Δη|<3.3, 2.8<|η|<3.3. Small η, small Δη
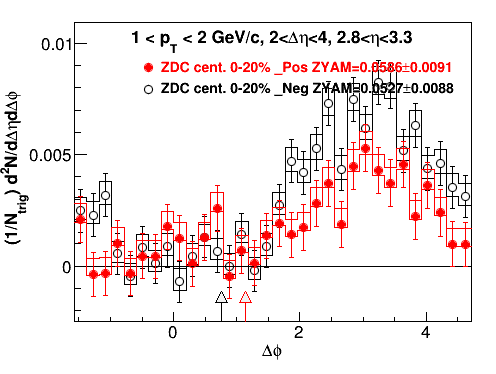
The second row: 2<|Δη|<4, 2.8<|η|<3.3 Small η, large Δη
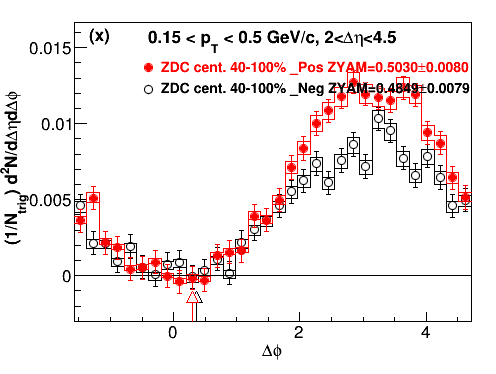
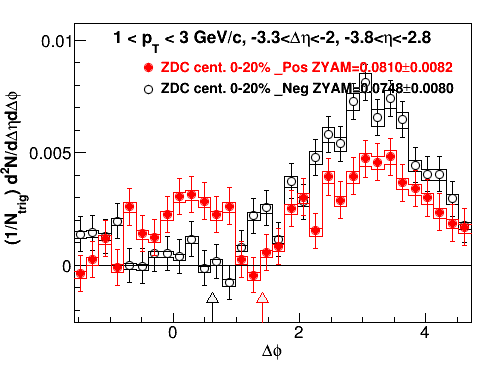
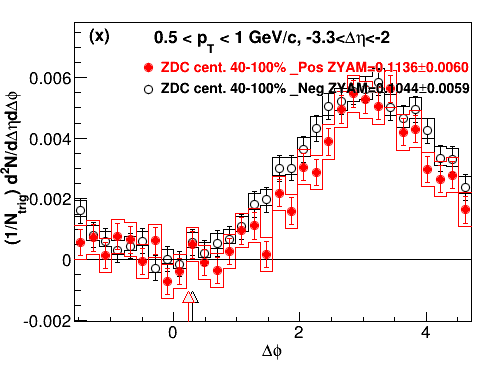
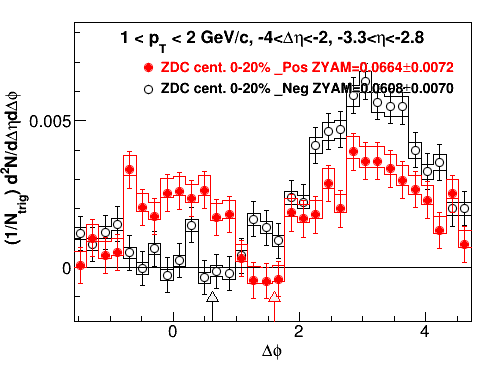
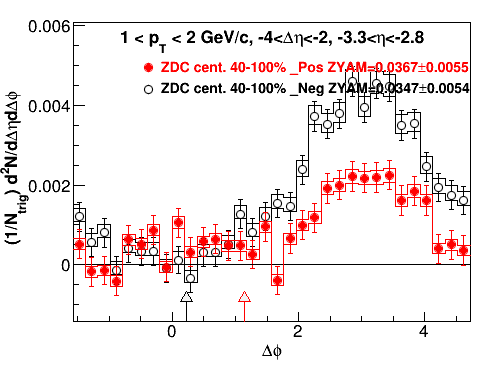
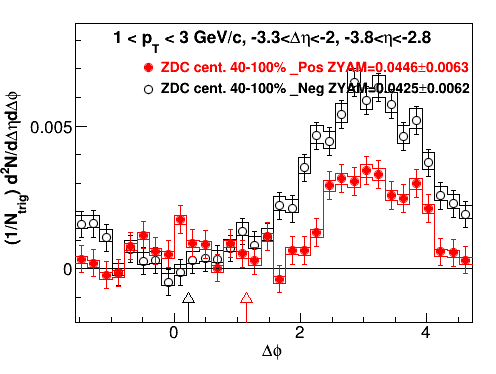
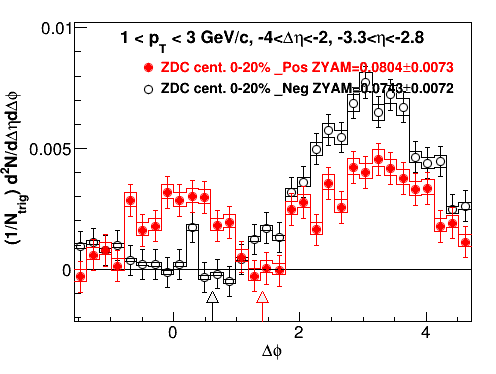
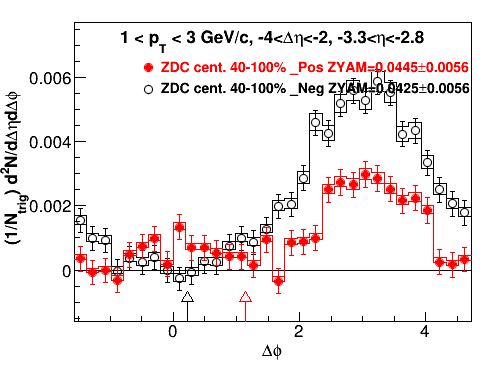
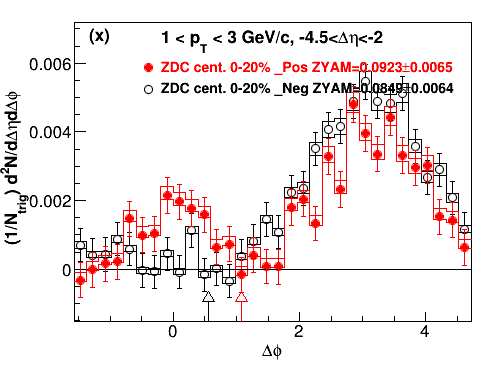
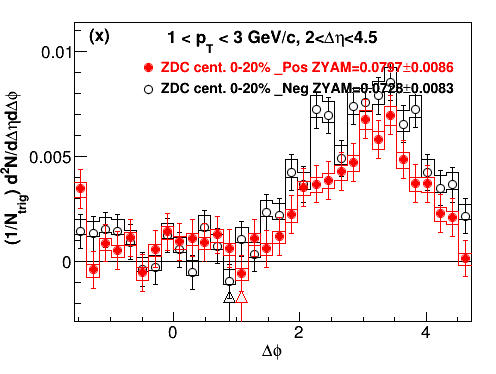
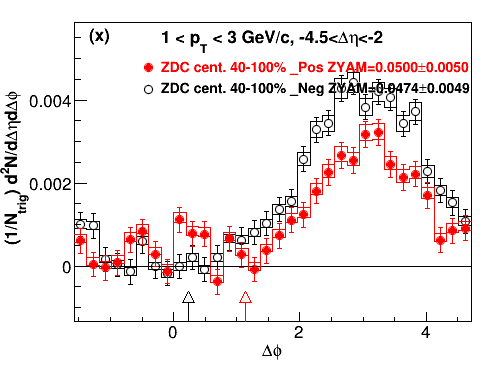
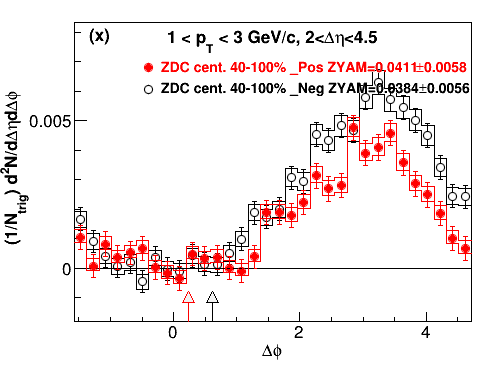
The third row: 2<|Δη|<4.5, 2.8<|η|<3.8 Large η, large Δη
Each row: Au-side 0-20%, d-side 0-20%, Au-side 40-100%, d-side 40-100%.
What to expect if our hypothesis is correct:
From the first to the third row, the near-side ridge structure increases.
Note: The dihadron correlations magnitude below needs scaled by 1/2.
1. 0.15 < pT< 0.5 GeV/c
| Au-side 0-20% | d-side 0-20% | Au-side 40-100% | d-side 40-100% |
 |
 |
 |
 |
 |
 |
 |
 |
 |
 |
 |
 |
 |
 |
 |
 |
 |
 |
 |
 |
 |
 |
 |
 |
3. 1 < pT < 2 GeV/c
 |
 |
 |
 |
 |
 |
 |
.png) |
 |
 |
 |
 |
4. 1 < pT < 3 GeV/c
.png) |
 |
 |
 |
 |
 |
 |
 |
 |
 |
 |
 |
Conclusion:
1. No near-side ridge in [0.15, 0.5] GeV/c.
Near-side ridge is seen in [0.5, 1], [1,2], [1,3] GeV/c for Au-side, central 0-20%, positive associated particle.
Some hints of near-side ridge in :
[1,3] GeV/c, 40-100%, Au-side, positve associated
[0.5,1] GeV/c, 0-20%, Au-side negative associated'
2. For those have the near -side ridge, from bottom to bottom, decrease ftpc |η|, decrease |Δη| :
The near-side ridge goes more obvious.
The away-side, positive associate particle yield decreases relatively to the the negative particle yield.
Discussion:
1. The small pT [0.15, 0.5] GeV/c region
a. FTPC detection issue?
In Frank's paper: http://arxiv.org/abs/0706.0472v2, it mentioned the issue with pT< 0.7 GeV/c for FTPC-Au side.
"
v11(pt1,pt2) ~ v1(pt1)*v1(pt2) - c*pt1*pt2
c is believed to be 1/(M*<pT^2>)
Momentum conversation is large at small pT. Even there is near-side ridge for [0.5,1], it may not be seen because of the large v1.
2. Small |η| indeed has stronger signal as expected.
Note to fuqiang: The small eta, d-side, 1-3 GeV/c, central 0-20% plot with somewhat near-side peak with large fluctuation for both pos. and neg. charge we discussed. It is from dAuCombined trgset. After including both dAuMinbias and dAuCombined, it is clear that there is no peak for negative. The old result doesn't have enough statistics.
- yili's blog
- Login or register to post comments