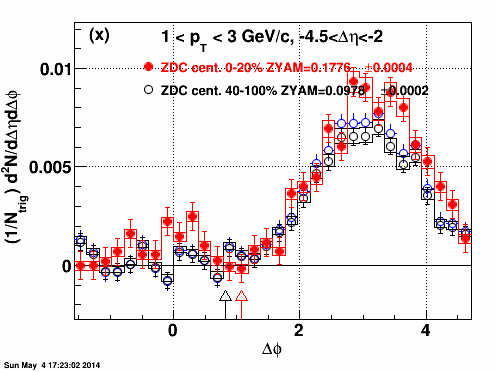
d+Au ridge: Fluctuation in TPC-FTPC Au side Dihadron Correlation
----------------------------------------2014.05.04--------------------------------------------------
The TPC-FTPC Au Dihadron Δφ correlation has large fluctuation.
Here is real/mix signal histogram:
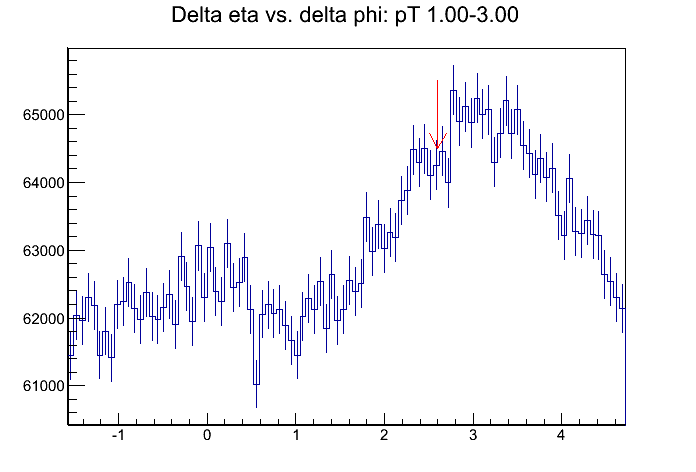
Look the red point for the ZDC central 0-20%. There are several jumps for those red point. For example, around Δφ=2.7.
So we look into real and mix events separately.
Real event:
Mix event:
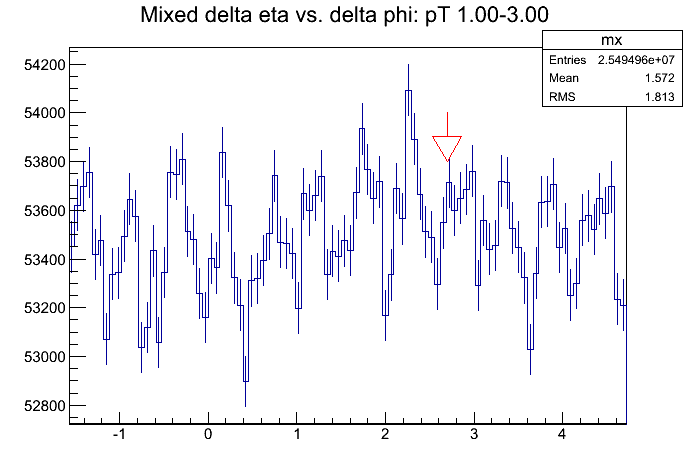
From the mix events, the boundary effect is clearly shown. The real event seems also show this feature, but not clear.
When do real/mix:
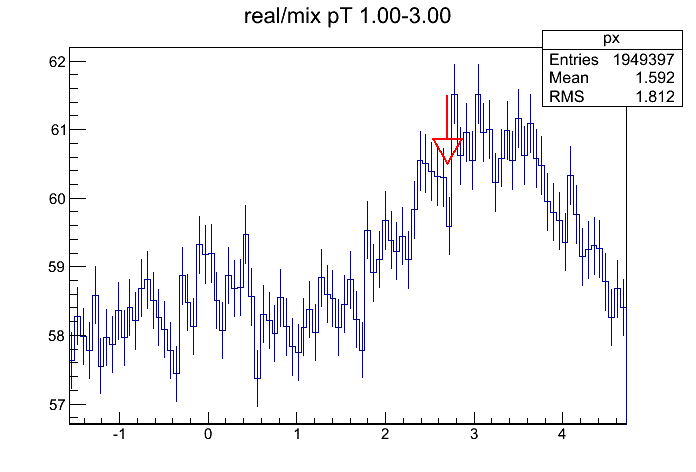
The points jump up and down. Since the boundary effect is not clear in real event, but is clear in mix event. The ratio real/mix gains more structure than real event along.
However, this itself cannot explain all the large fluctuations.
--------------------------------------END--2014.05.04--------------------------------------------------
----------------------------------------2014.05.05 --------------------------------------------------
1. -------------------------------------TPC x FTPC --------------------------------------------------
For the mix event, we do FullField (B>0) and ReserveFullField (B<0) separately for different charge combinations.
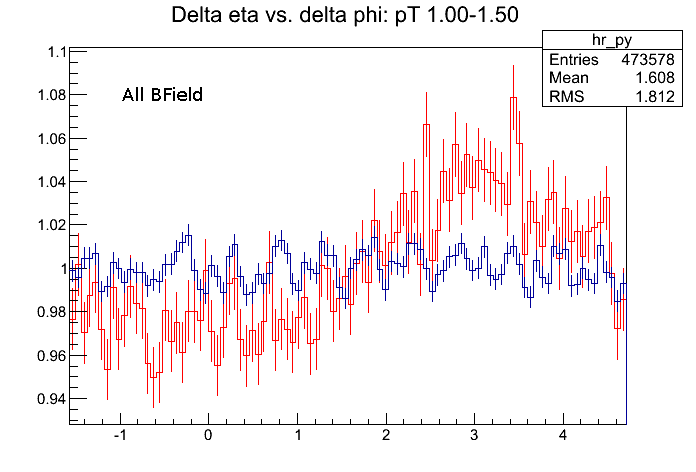
Let's look at the case both the trigger and associate particles are negative charges.
1. FullField: Real event vs Mix event: (ignore the title. it is 1-3 GeV/c)
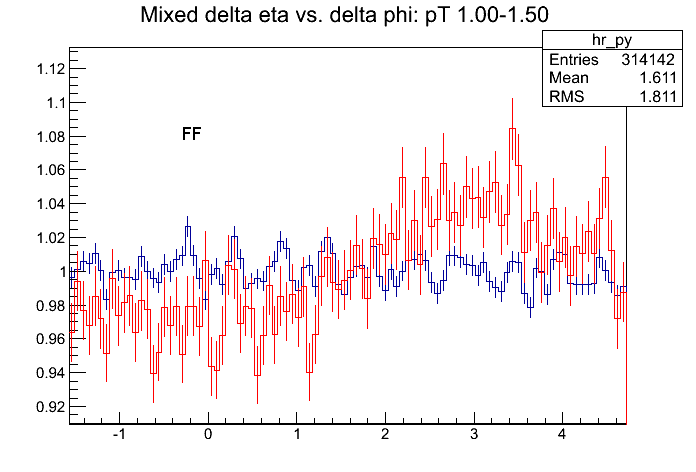
It is hard to tell whether they are matched or not.
2. ReserveFullField: Real event vs Mix event (ignore the title. it is 1-3 GeV/c)
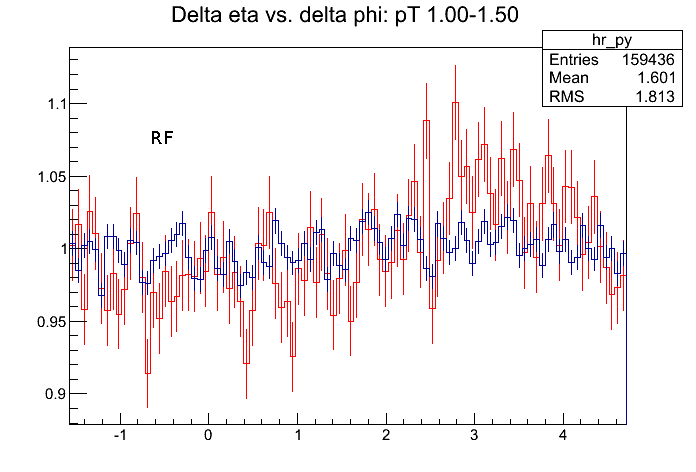
It seems matched (those dips).
3. Mix event: RF vs FF
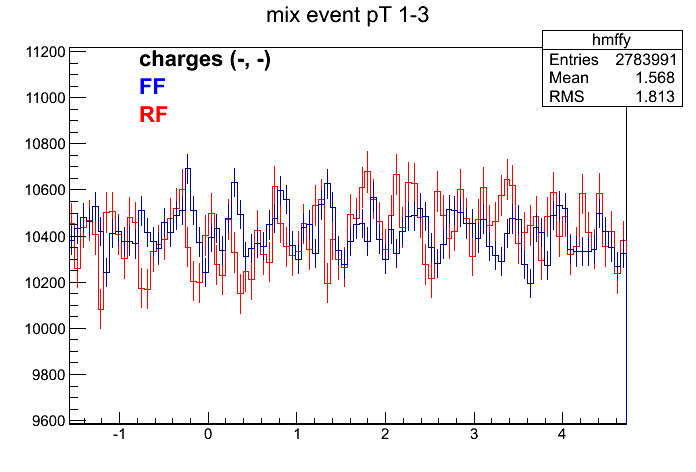
They are shifted by 1 or 2 bins.
4. Real Event: RF vs FF
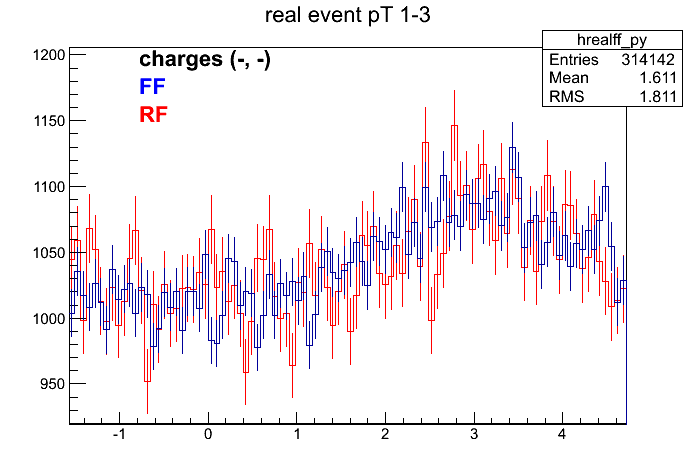
Hard to say.
5. Merge RF and FF together: Real vs Mix (ignore the title. it is 1-3 GeV/c)
Not clear to me.
2. -------------------------------------TPC x TPC --------------------------------------------------
However, the same method/code looks fine for TPC x TPC correlations
1. real event:
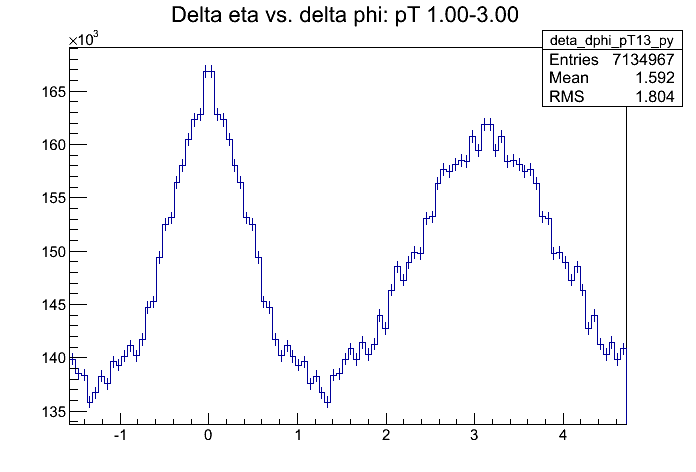
Clear patterns.
2. Mix event:
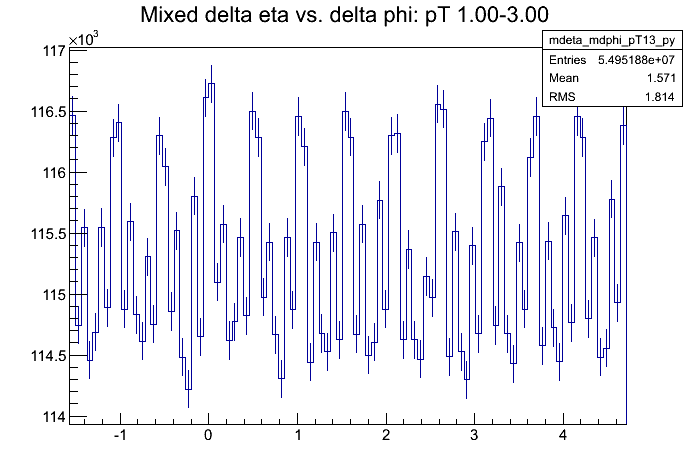
Patterns.
3. real/mix: (1D divided by 1D)
.gif)
Pattern corrected by mix event.
--> Why the same code work for TPC x TPC but make TPC x FTPC worse??
--------------------------------------END--2014.05.05--------------------------------------------------
------------------------------------------2014.05.06--------------------------------------------------
Single Particle φ distribution
1. TPC:
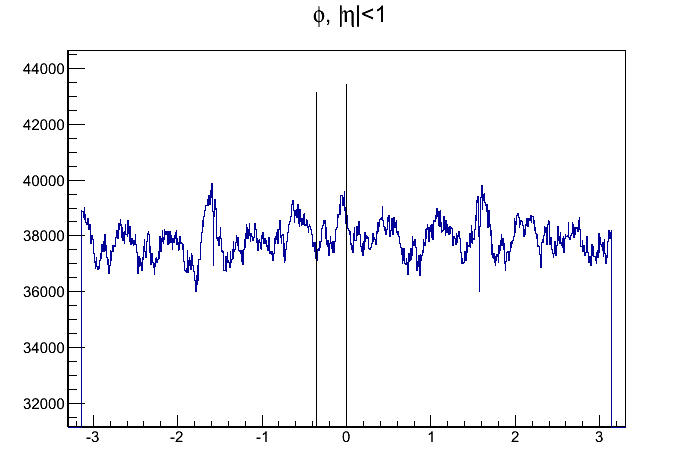
12 dips. one dip at -0.23
2. FTPC:
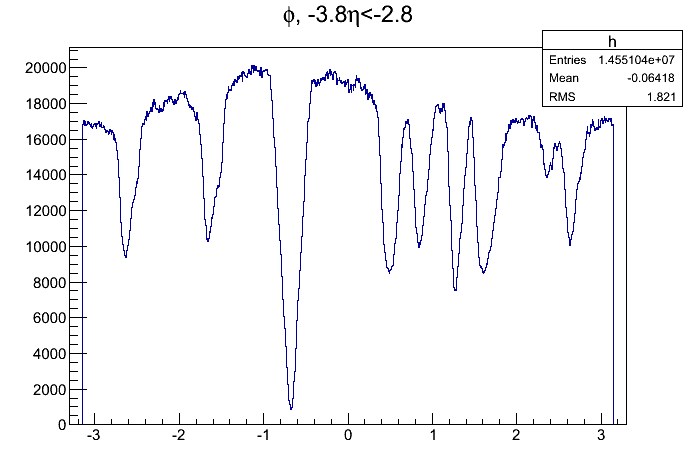
6 dips. one dip at -0.65
So for TPC x FTPC correlation, one dip will be at -0.33. While, it is not the dip we see from the mix event.
--------------------------------------END--2014.05.06--------------------------------------------------
- yili's blog
- Login or register to post comments