d+Au ridge: More Peripheral, More Central
Motivation:
In d+Au Ridge study, 0-20% and 40-100% have been analyzed for central and peripheral. See drupal.star.bnl.gov/STAR/blog/yili/dau-ridge-global-tracks-inclusive-charge.
Cent-R*Peri method has been discussed and two double-ridge is found.
Here we'd like to go to more peripheral 60-100% and more central 0-10% to investigate whether conclusion will be affected. Or in another word, if there is flow/ridge in 40-100%, how large the contribution will affect the subtraction result.
Method:
Dihadron correlation.
Fit near-side Δη with Gaussian + Pedestal. Fit parameters Y for Gaussian area, σ for Gaussian width, C for pedesta. For both central and peripheral.
1. Near-side jet yield central over peripheral ratio R.
2. Cent - R x Peri for dihadron correlation
Global tracks.
For events with |Vz|<50 cm:
FTPC East (Au-going) refMult centrality:
M >= 23 9.2%
M >= 22 10.6%
M >= 18 18.1%
M >= 17 20.5%
M >= 11 39.4%
M >= 10 43.4%
M >= 7 56.9%
M >= 6 61.9%
So
[22, 500] for 0-10%
[6, 21] for 10-60%
[0, 5] for 60-100%
ZDC East (Au-going) Attenuated ADC
ADC >= 134 9.3%
ADC >= 133 10.7%
ADC >= 129 17%
ADC >= 128 18.7%
ADC >= 127 20.6%
ADC >= 117 39.1%
ADC >= 116 40.8%
ADC >= 101 59.6%
ADC >= 100 60.5%
So
[133, 500] for 0-10%
[100, 132] for 10-60%
[0, 99] for 60-100%
For events with |Vz|< 30 cm:
FTPC East (Au-going) refMult centrality:
M >= 23 9.8%
M >= 22 11.2%
M >= 18 18.9%
M >= 17 21.3%
M >= 12 36.7%
M >= 11 40.4%
M >= 10 44.4%
M >= 7 57.8%
M >= 6 62.8%
ZDC East (Au-going) Attenuated ADC
ADC >= 134 9.5%
ADC >= 133 10.9%
ADC >= 129 17.3%
ADC >= 128 19.0%
ADC >= 127 20.8%
ADC >= 117 39.3%
ADC >= 116 41.0%
ADC >= 101 59.8%
ADC >= 100 60.7%
Data set:
Run3
|Vz| < 50 cm
nHitsFit > 25 points for TPC
nHitsFit > 5 points for FTPC
nHitsFit/nHitsPoss >= 51%
globa dca < 3 cm
|eta|<1 for TPC
2.8<|eta|<3.8 for FTPC
1<pT<3 GeV/c
Results:
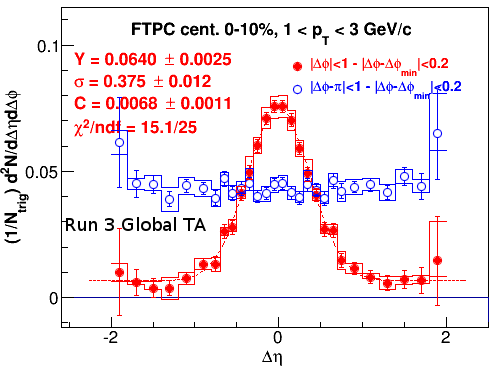
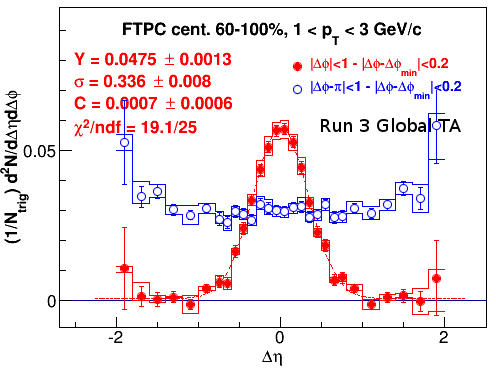
1. Near-side jet Δη distribution
Both trigger and associated particles in TPC
FTPC centrality
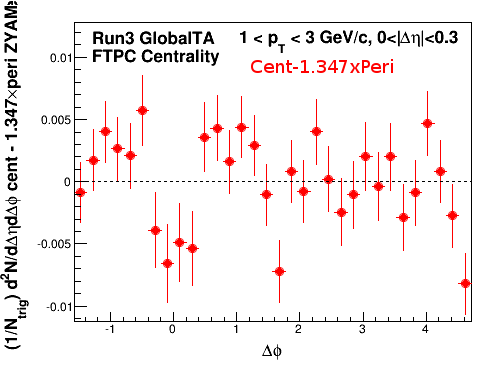
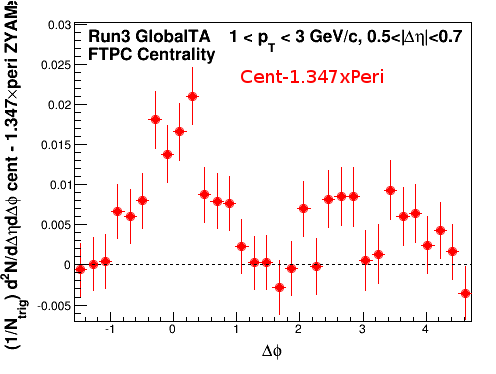
R = Y^cent / Y^peri = 1.347
| 0-10% | 60-100% |
 |
 |
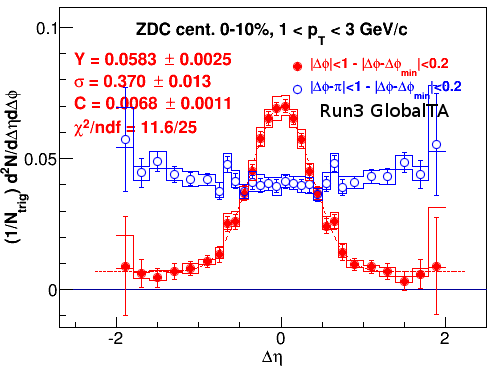
ZDC centrality
R = Y^cent / Y^peri = 1.2
| 0-10% | 60-100% |
 |
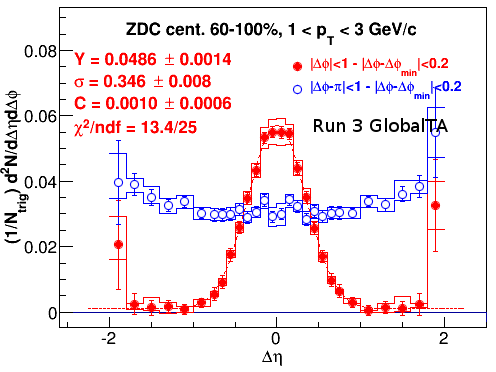 |
The away-side shapes are also different.
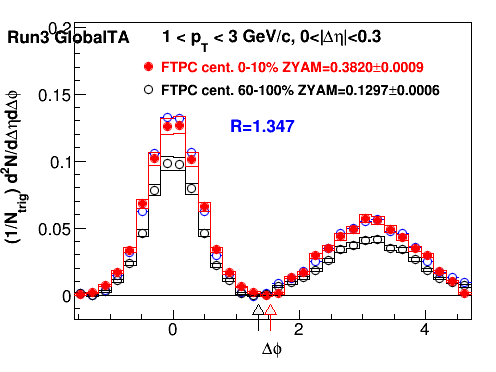
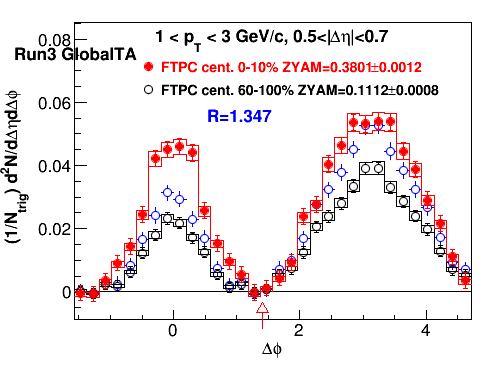
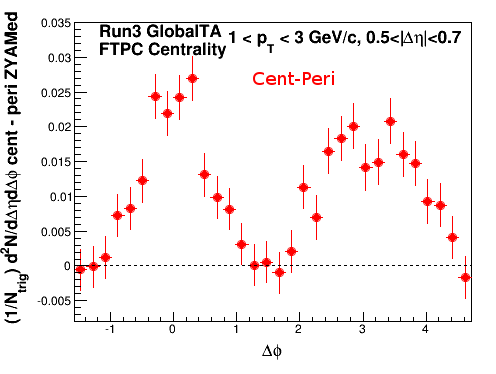
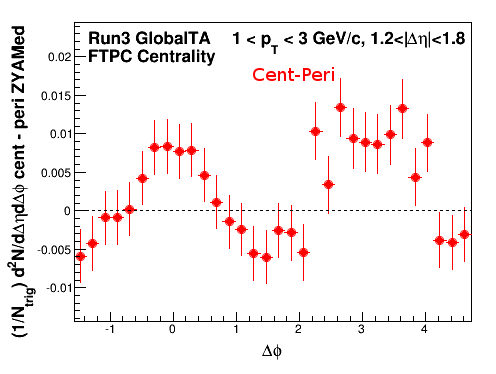
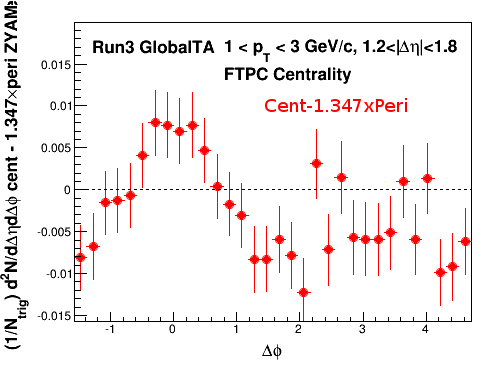
2. Cent - R x Peri
FTPC centrality
TPC x TPC correlations
 |
 |
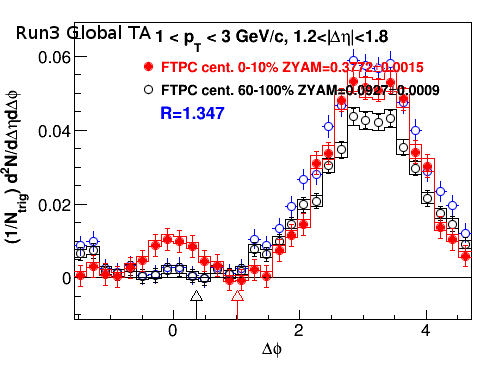 |
Red for central. Black for peripheral. Blue for scaled peripheral, scaled by R = Y^cent/Y^peri.
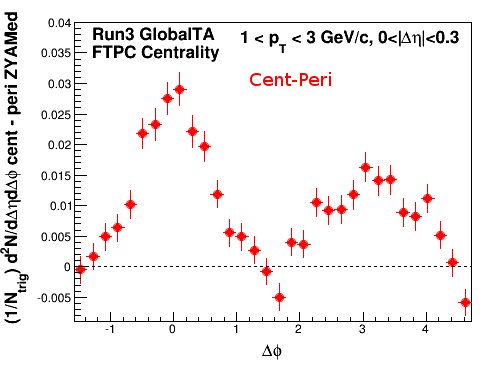
Cent-Peri
 |
 |
 |
Cent-RxPeri
 |
 |
 |
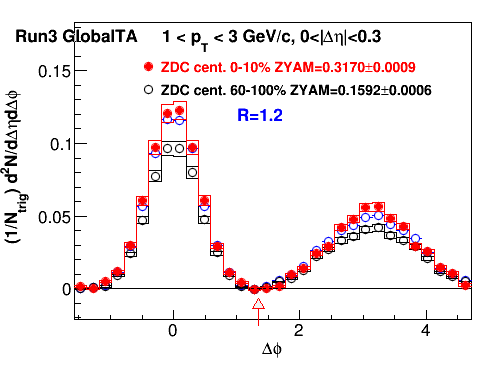
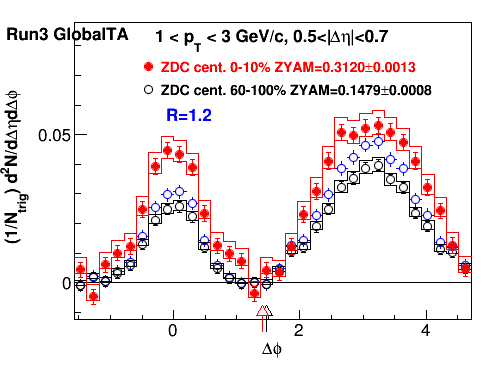
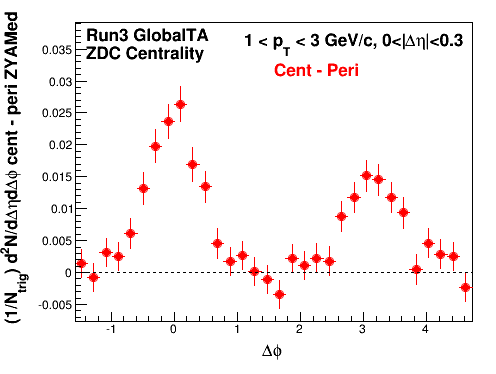
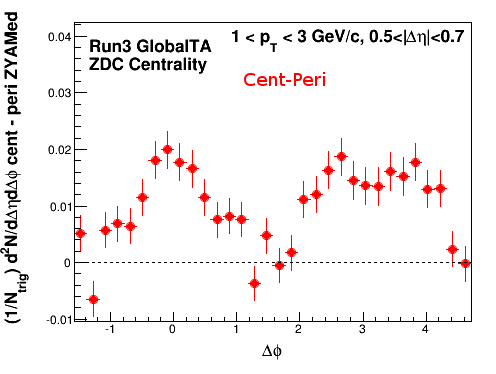
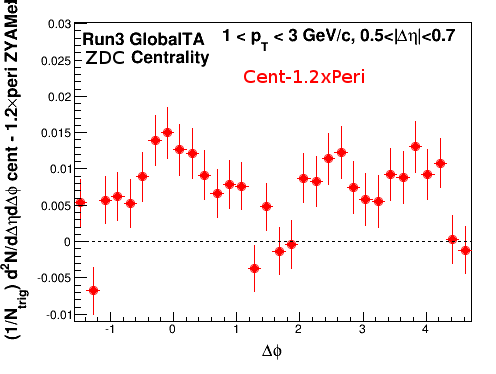
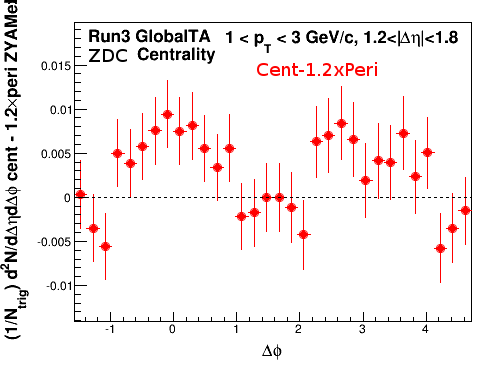
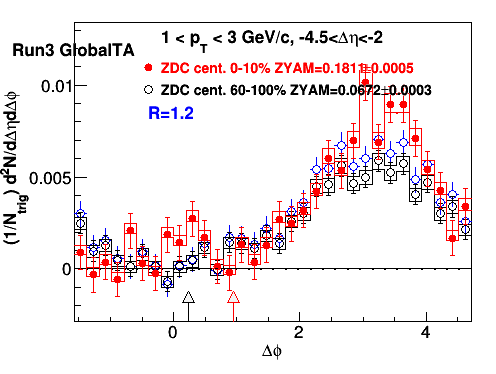
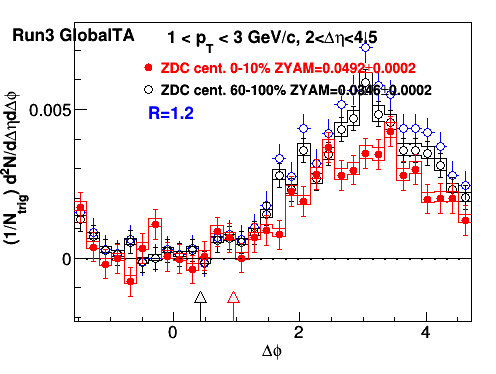
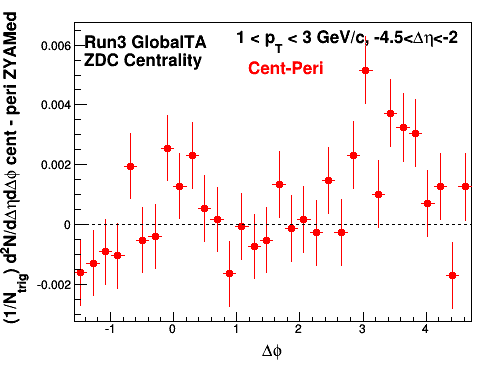
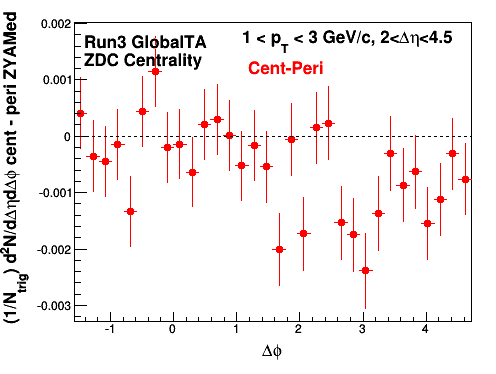
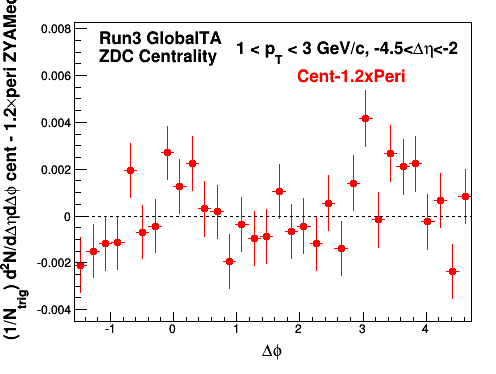
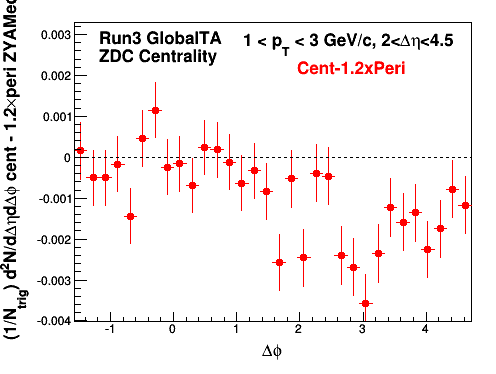
ZDC centrality
TPC x TPC correlations
 |
 |
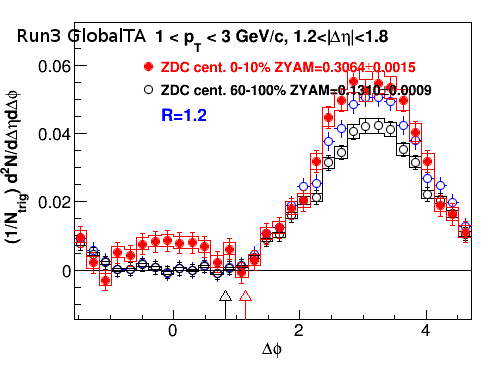 |
Red for central. Black for peripheral. Blue for scaled peripheral, scaled by R = Y^cent/Y^peri.
The away-side shape in 0.5 < |Δη| < 0.7 for central and peripheral are not the same. The scaled peripheral is still lower than central.
Cent-Peri
 |
 |
 |
Cent-RxPeri
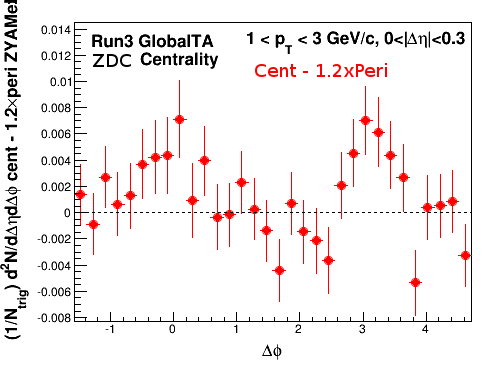 |
 |
 |
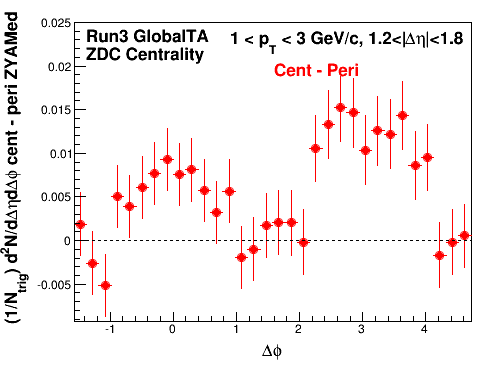
TPC x FTPC correlations
 |
 |
Cent-Peri
 |
 |
Cent-RxPeri
 |
 |
- yili's blog
- Login or register to post comments