d+Au Ridge: Near-side / Away-side Yield Ratio Delta eta Dependence
This page is documentary purpose.
Motivation:
How are the near-side and away-side yields dependence on Δη may tell us whether they have any internal connection or not.
If we observe they follow the same trend, it may indicate they are connected.
We will focus on the central collisions (0-20%), since the peripheral collisions shows no Ridge structure.
Method:
Dihadron correlation. Calculate the ZYAMed correlated yield in near-side (|Δφ|<1.047) and away-side (|Δφ-π|<1.047) for different Δη windows. For TPC-FTPC correlation, the Δη windows are chosen as [-4.5,-3.5], [-3.5,-3], [-3,-2].
Global/primary track are both discussed .The dihadron correlation below shown is ZYAM substracted.
Data set:
Run3
|Vz| < 50 cm
nHitsFit > 25 points for TPC
nHitsFit > 5 points for FTPC
nHitsFit/nHitsPoss >= 51%
globa dca < 3 cm
|eta|<1 for TPC
2.8<|eta|<3.8 for FTPC
1<pT<3 GeV/c
Results:
1. Global tracks
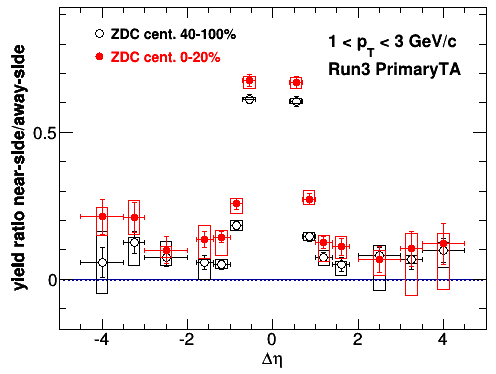
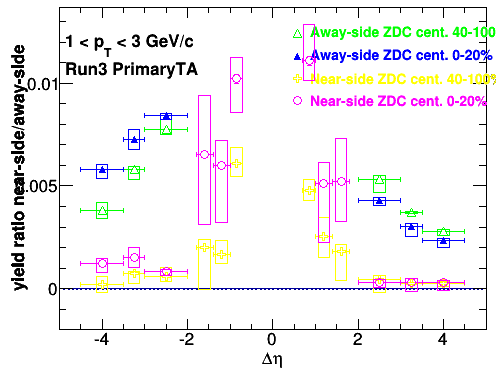
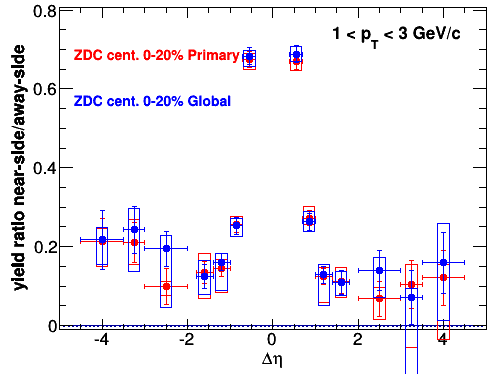
Near-side/Away-side ratio:
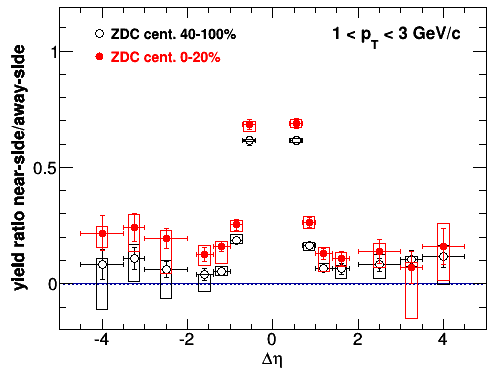
The three red points to the left are TPC-FTPC correlations. It seems no dependence on Δη.
Let's see how is the near-side and away-side yield by themselves:
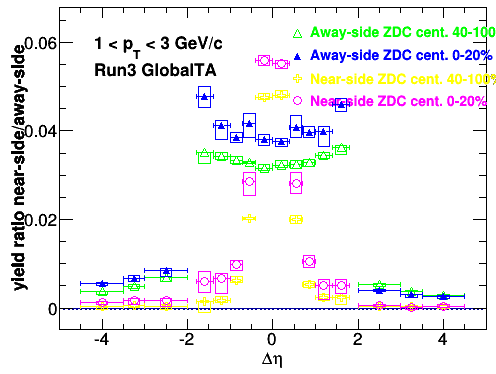
The three blue points to the left are away-side yield, which obviously decreas as |Δη| increases.
For the near-side yield, zoom in the plot:
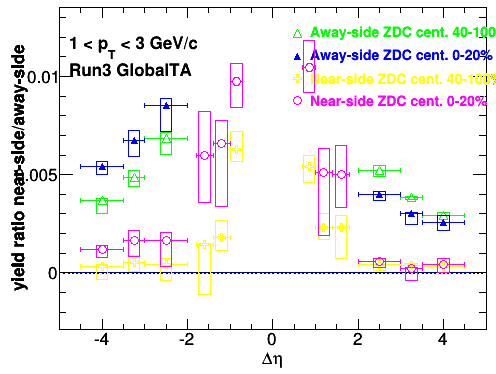
The three pink points to the left are near-side yield. They also seem no dependence on Δη.
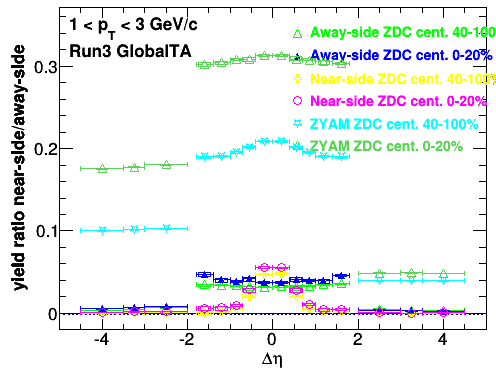
For ZYAM numbers (underlying event yield):
when zoomed in:
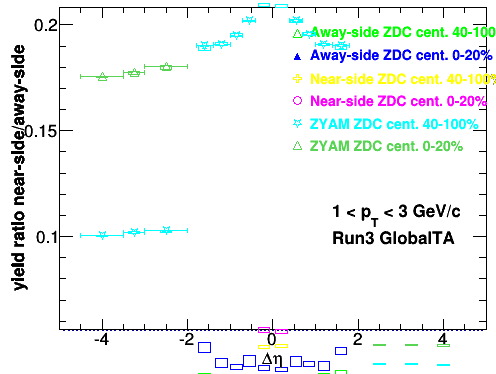
Dark green up triangle is ZYAM 0-20%. Cyan down triangle is ZYAM 40-100%.
ZYAM slightly drops as |Δη| increase towards Au-side.
Near side yield/ZYAM
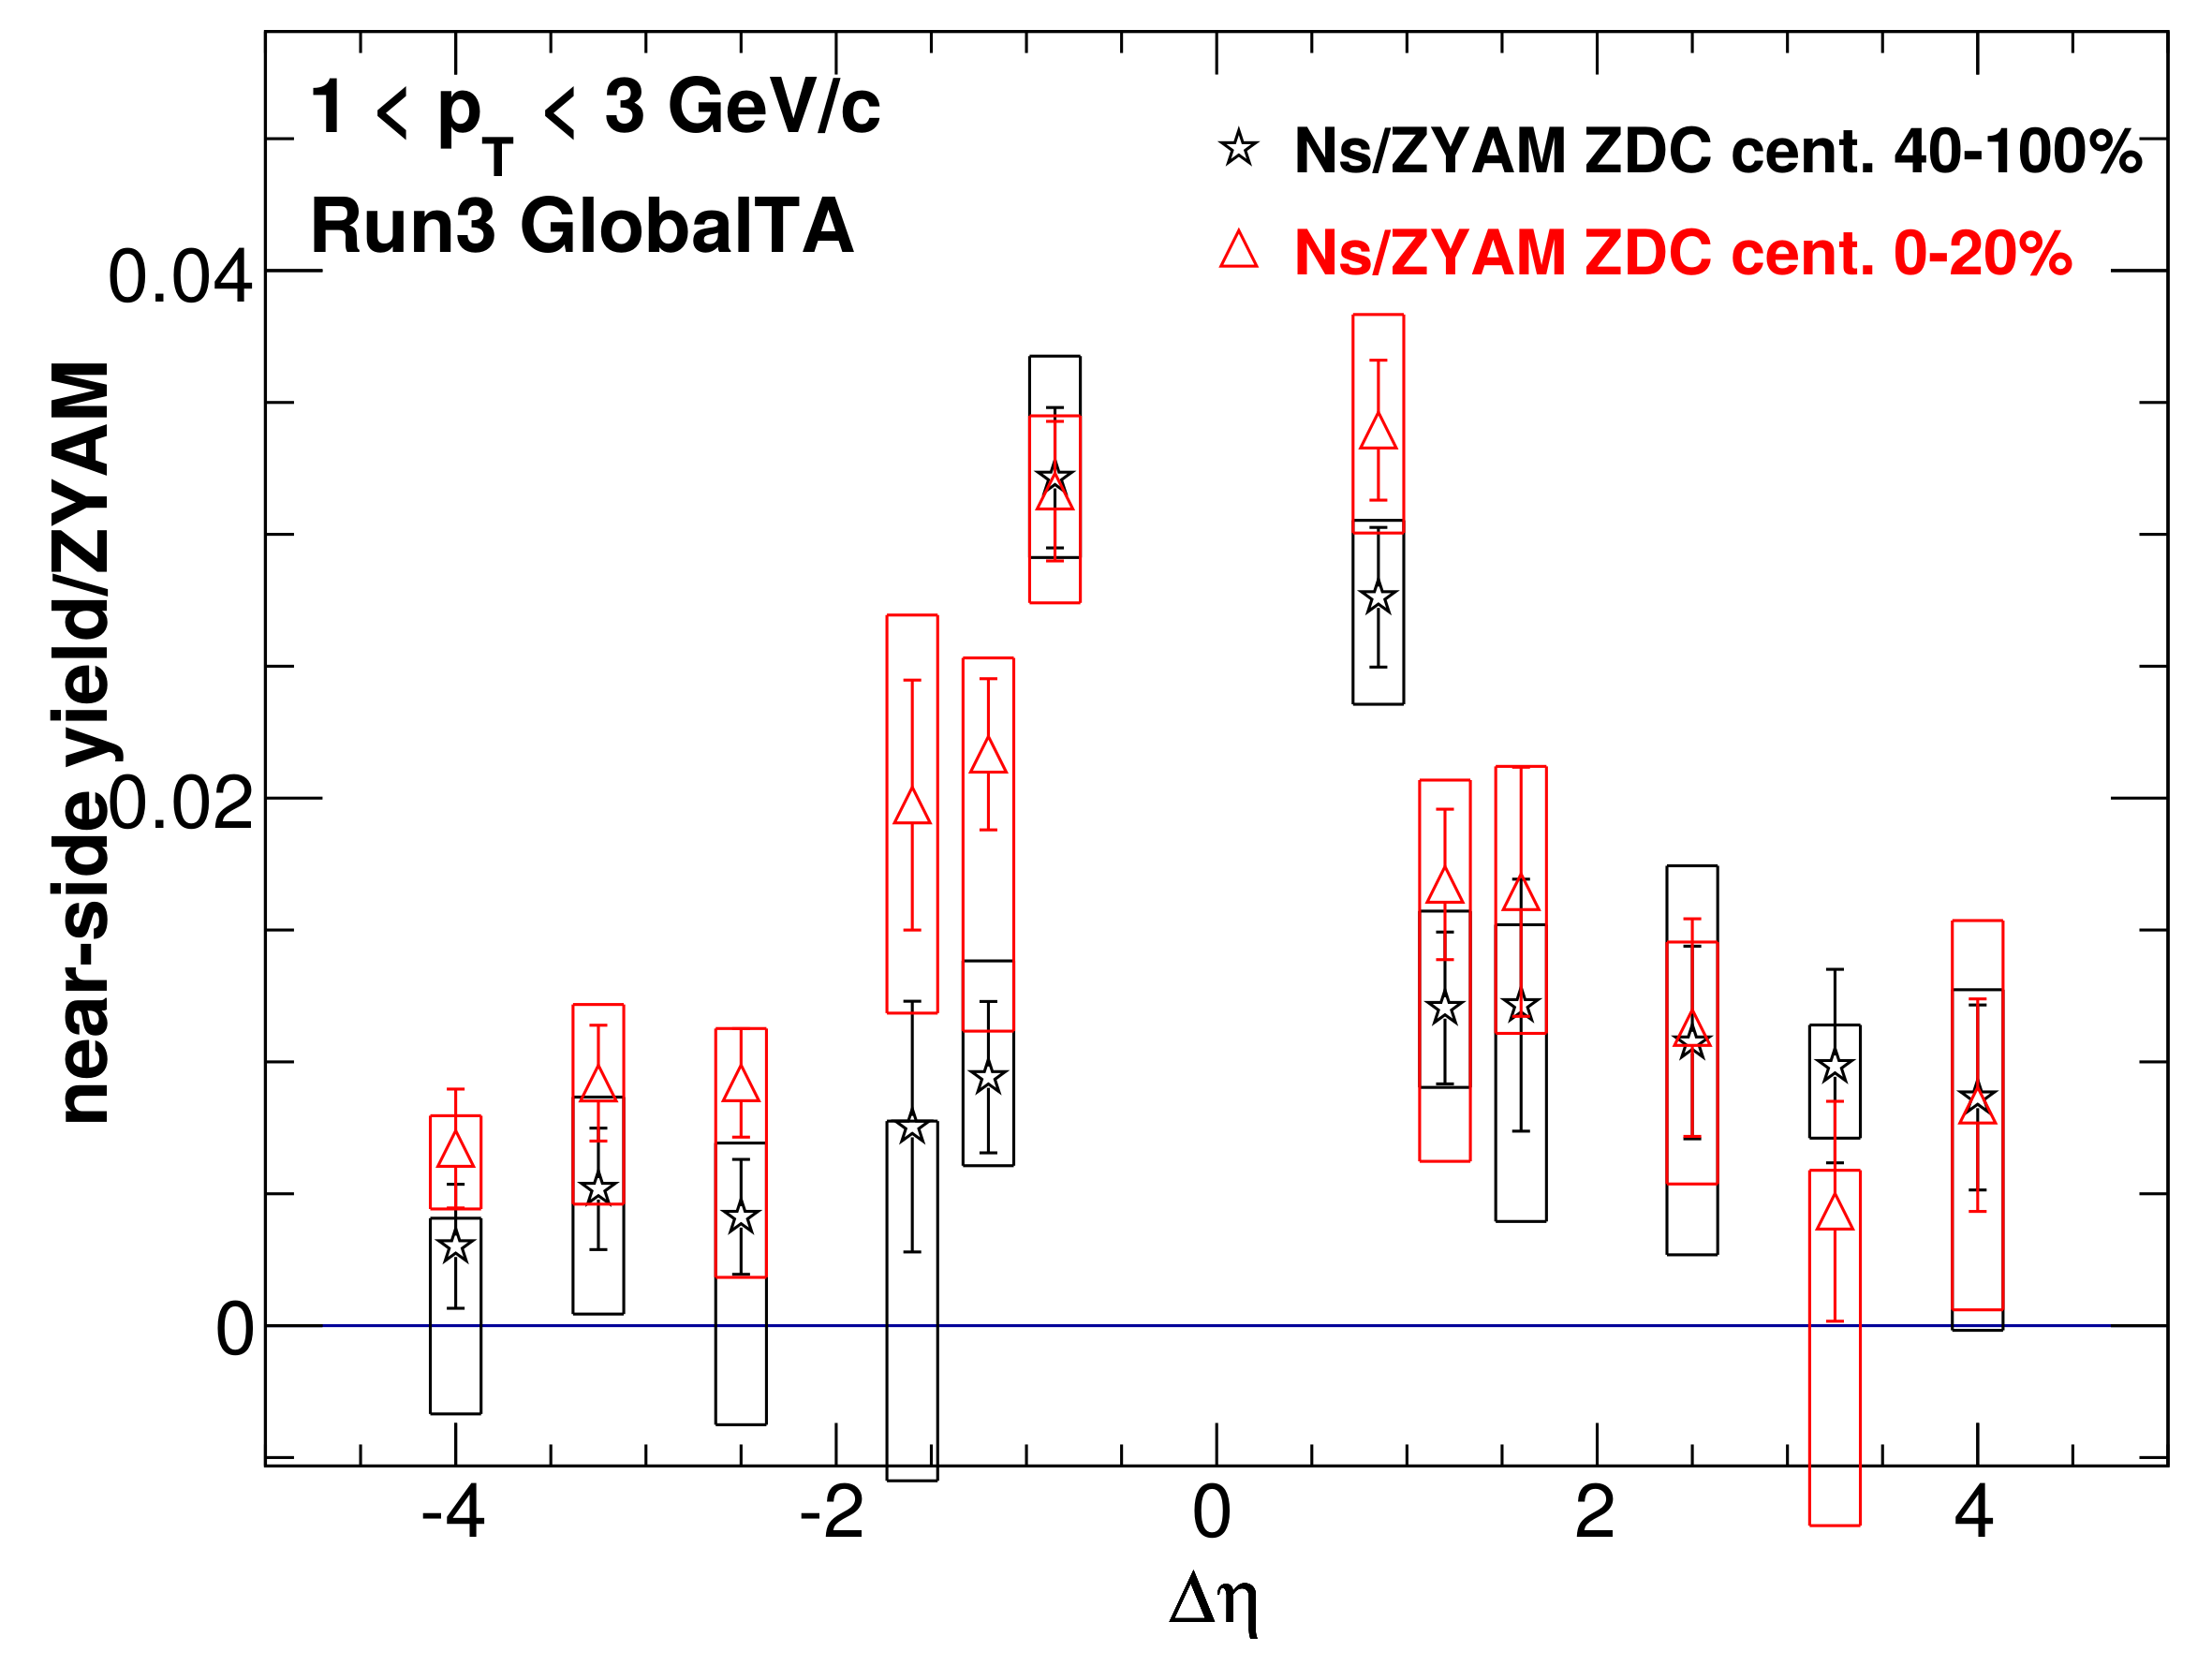
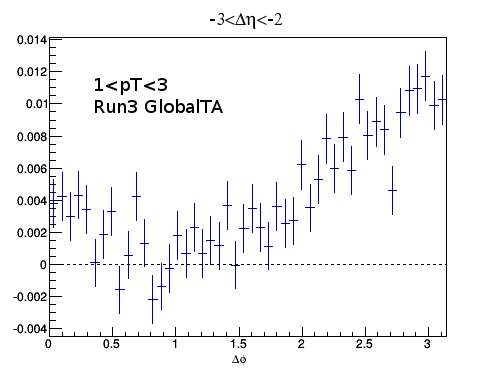
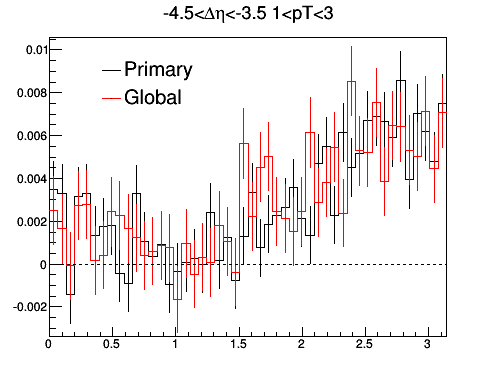
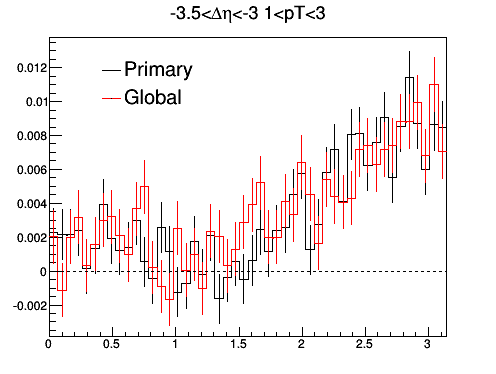
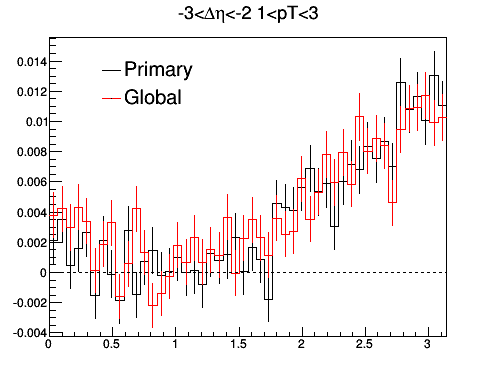
For the first three points, let's look at their Δφ distribution (ZYAMed):
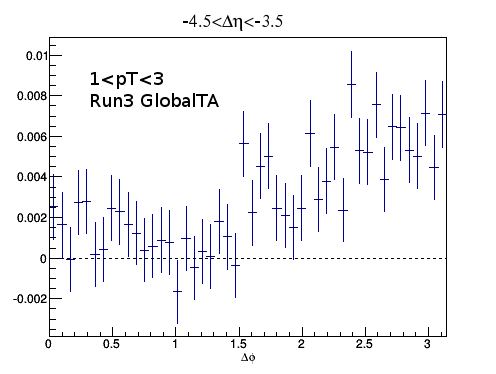 |
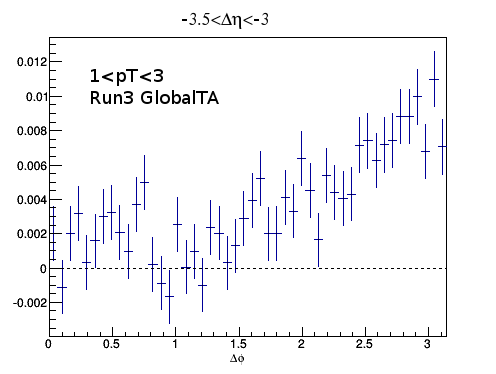 |
 |
2. Primary tracks
Near-side/Away-side Ratio
Same plots. Just right is log scale for y axis.
 |
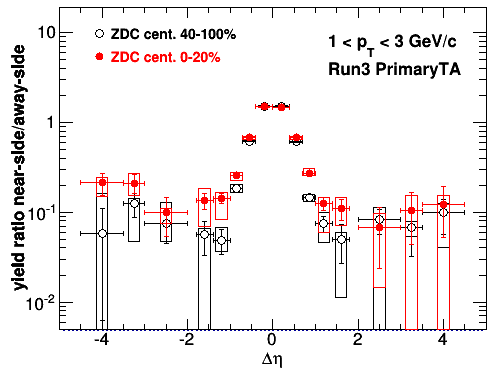 |
It seems the ratio increases as |Δη| increases.
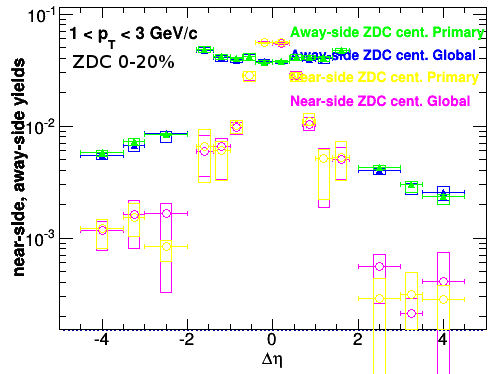
Away-side and near-side yields:
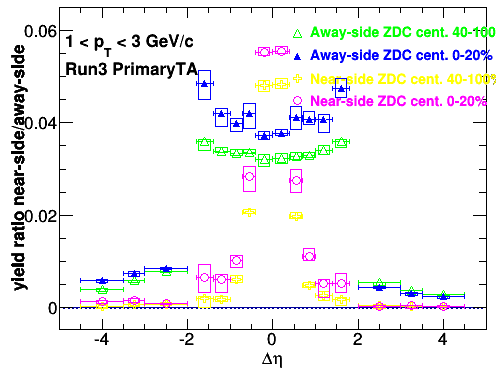
Away-side decreases as |Δη| increases.
And zoomed in:
Near-side stays constant.
For ZYAM:
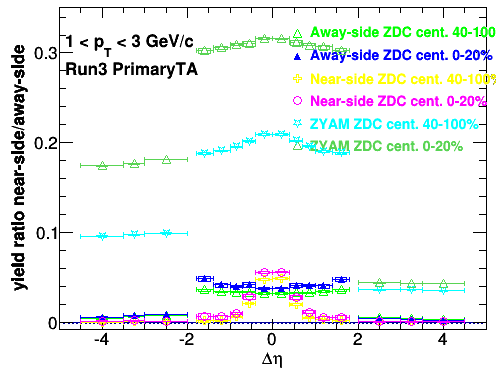
when zoomed in:
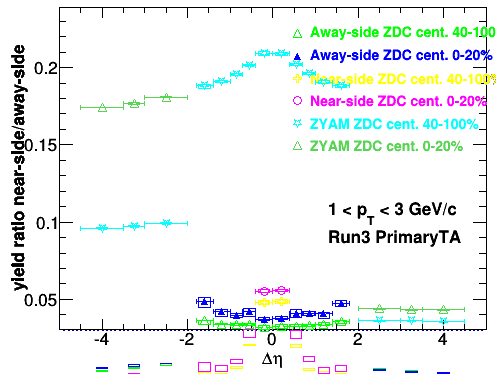
Dark green up triangle is ZYAM 0-20%. Cyan down triangle is ZYAM 40-100%.
ZYAM slightly drops as |Δη| increase towards Au-side.
When using logy, scale ZYAM/20, not ploting positive Δη side:
.png)
Near-side yield/ZYAM
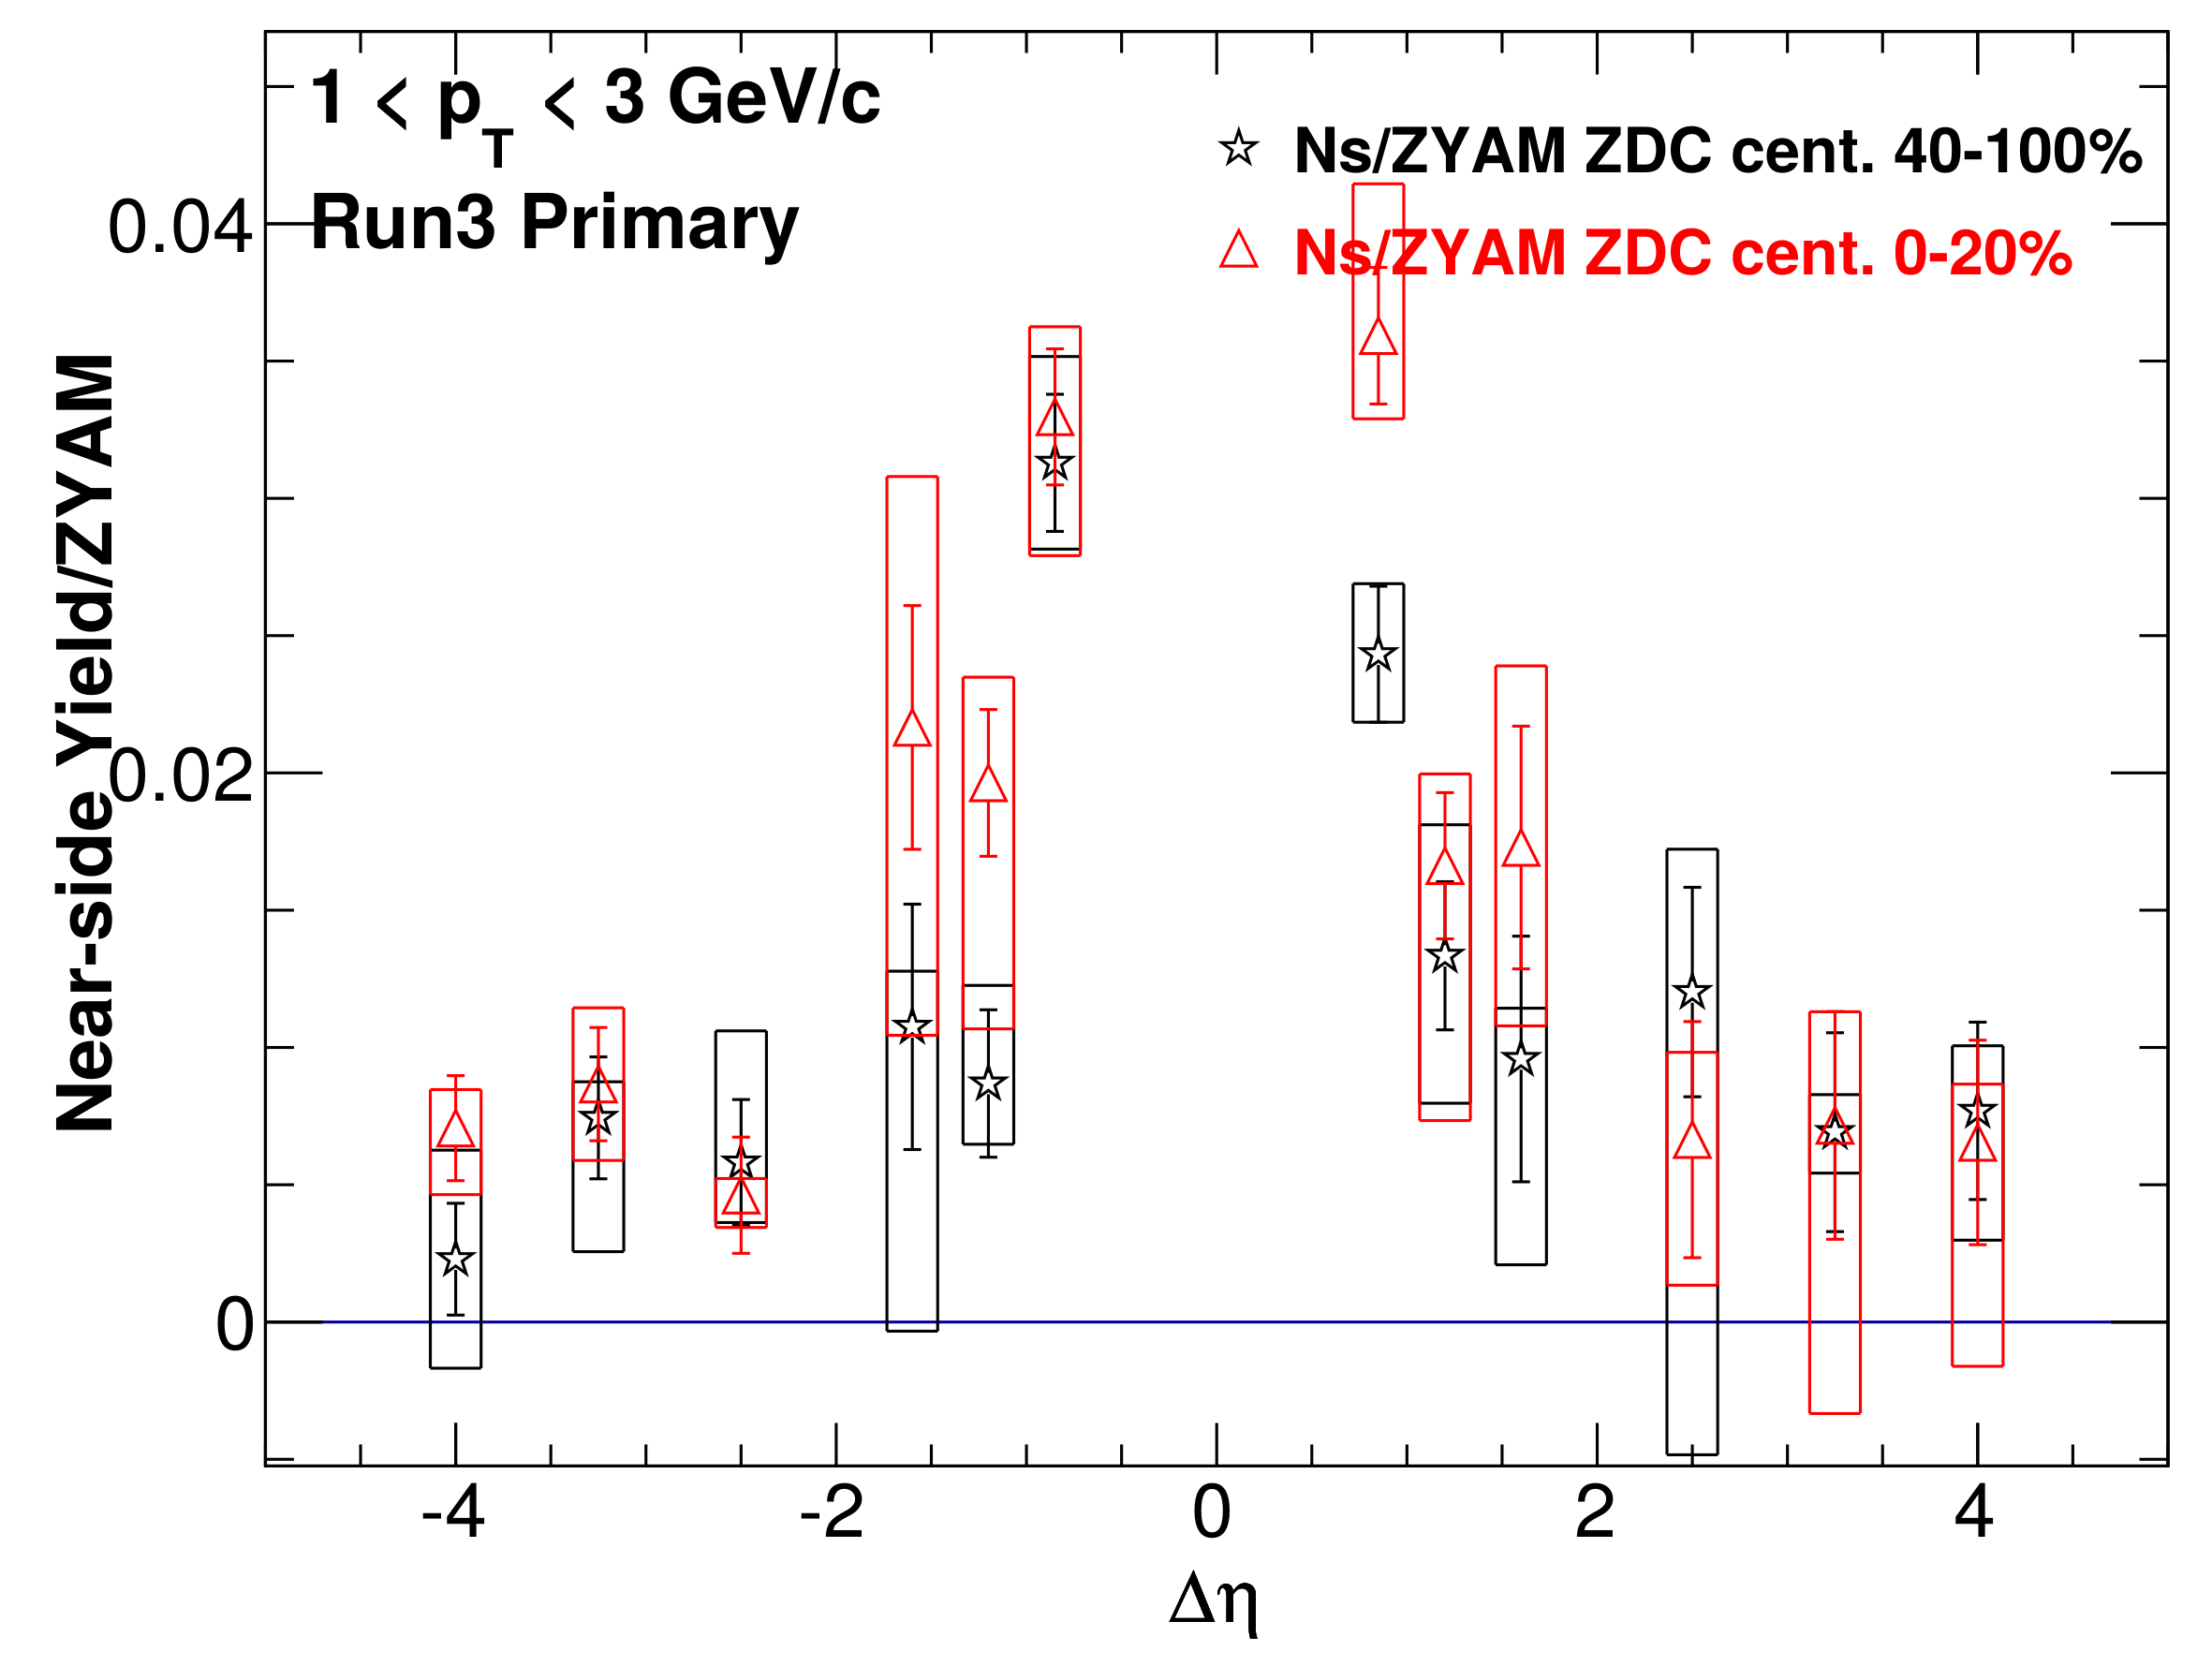
For the first three points, let's look at their Δφ distribution (ZYAMed):
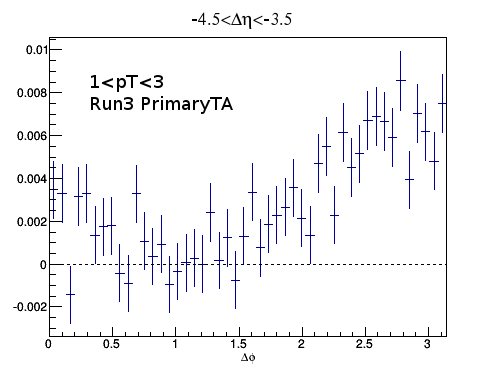 |
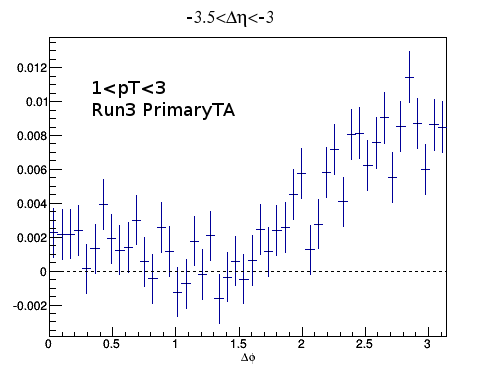 |
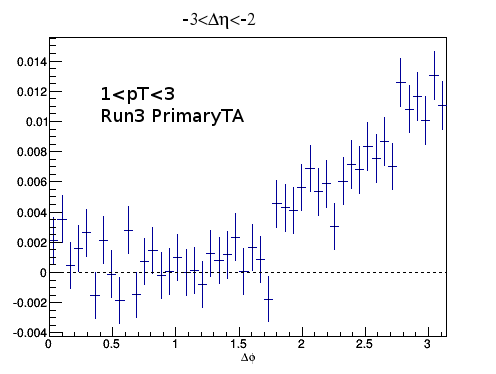 |
3. Primary vs Global
Near-side and away-side yield in 0-20%
Near-side/Away-side ratio in 0-20%
Δφ distribution for 0-20%
 |
 |
 |
Conclusion:
In TPC-FTPC Au going correlations:
As |Δη| increases.
1. Away-side jet dominated yield decreases
2. Near-side ridge has no dependence on |Δη|.
- yili's blog
- Login or register to post comments