d+Au ridge: PosItive/Negative From MC with GEANT, Hijing, BRAHMS
This page is documentary purpose.
Motivation:
Charge particle ratio is observed to be different between FTPC data and Hijing simulation in d+Au collisions. FTPC charge identification ability is important in Ridge charge dependence study.
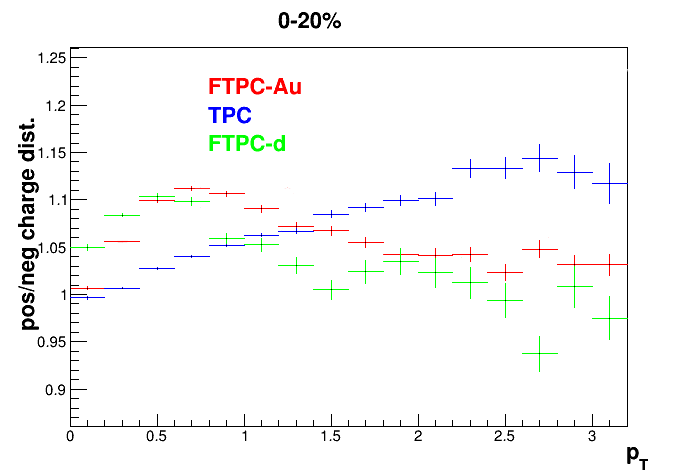
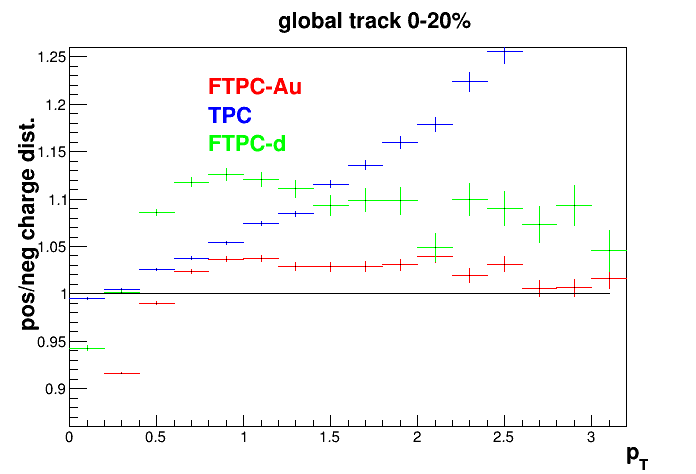
From the Hijing inclusive particle study, the positive/negative ratio goes up at FTPC acceptance. However, the real data shows increase at low pT, and slight drop off at higher pT for both primary and global tracks.
| Hijing | Real Data Primary Tracks | Real Data Global Tracks |
 |
 |
 |
See: www.star.bnl.gov/protected/bulkcorr/yili/dAuRidge/1stGPC.html
drupal.star.bnl.gov/STAR/system/files/GPCII_140605.pdf
Method:
1. Hijing/BRAHMS particle identification (PID) charge ratio.
2. MC after GEANT inclusive charge ratio
Data set:
Hijing data are generated using Hijing event generator.
BRAHMS data are from Hongyan Yang's PhD thesis.
MC after GEANT are STAR MC data, dau200/hijing_381/b0_20/minbias_wideZ/year2003/hadronic_on
Results:
1. Particle Identificaiton charge ratio from Hijing and BRAMHS.
Note: Those plots in this section are the only place Neg/Pos instead of Pos/Neg used.
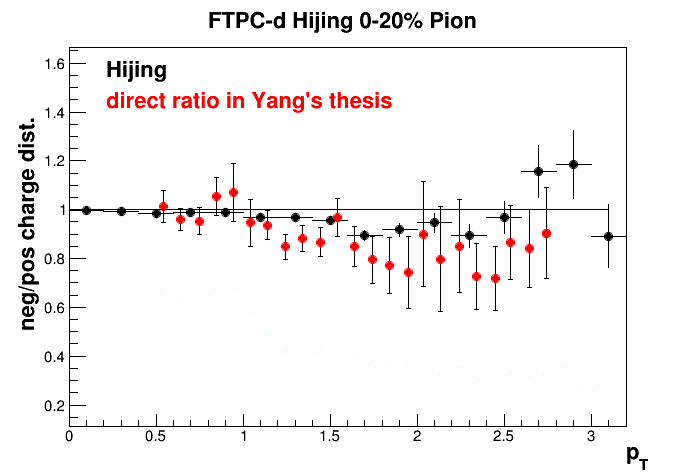
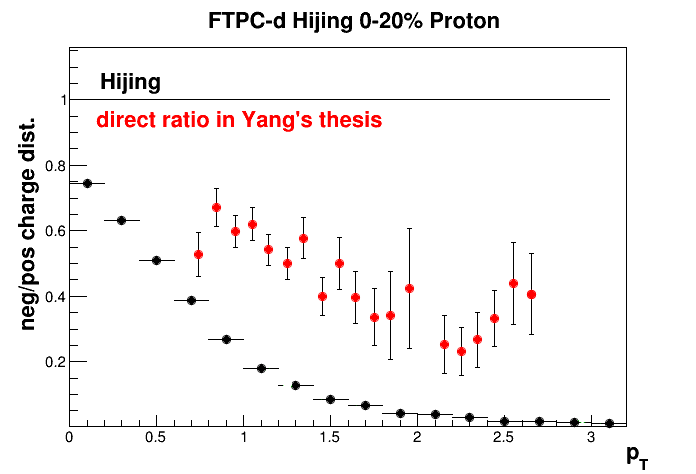
1.1. d-going side
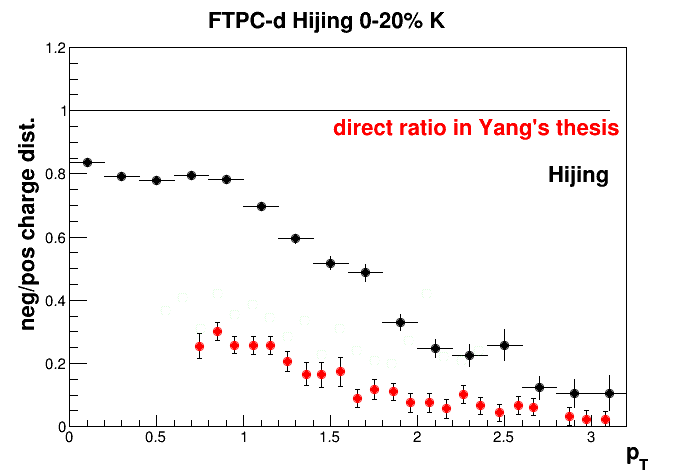
BRAMHS record the data on d-going side. Data taken from Yang's thesis anti-particle/particle ratio plots, 2.9<η<3.1, MB (The 0-30% and 30-60% doesn't suggest centrality difference.)
Hijing use 2.8<η<3.8, 0-20%. The η coverage is the same as STAR FTPC d-going side.
| Pion | Proton | Kaon |
 |
 |
 |
Pion data are consistent between BRAMHS measurement and Hijing simulation.
Proton and Kaon results show similar trend between data and simulation but quantatively different.
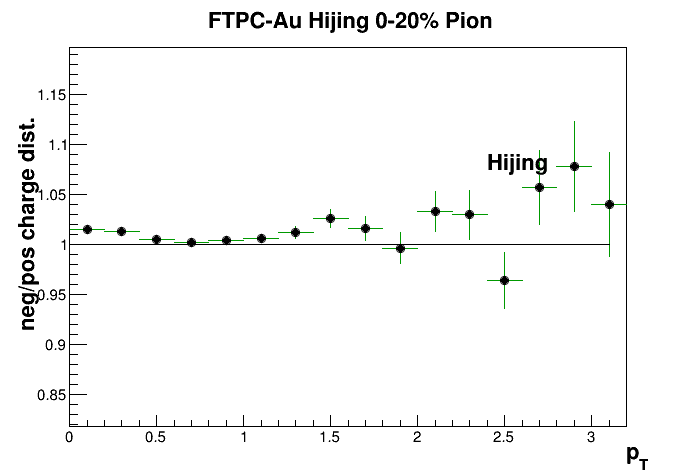
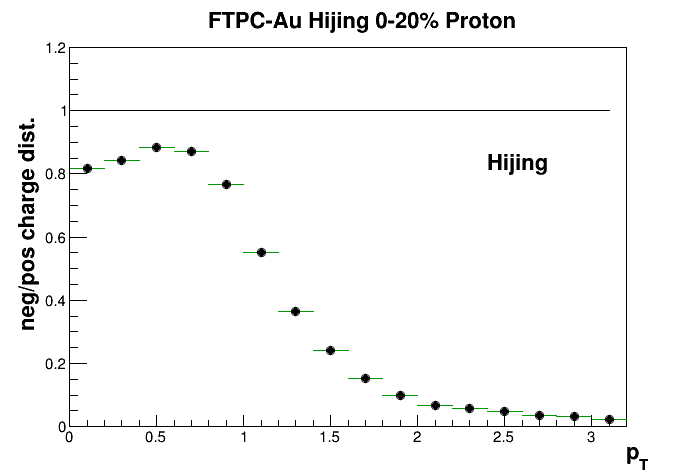
1.2 Au-going side
BRAMHS don't have Au-going data. Here only presents the Hijing simulation.
Pion: Neg/Pos is consistent with unity.
Proton: Neg/Pos descreases at pT increase
More proton at higher pT than pion:
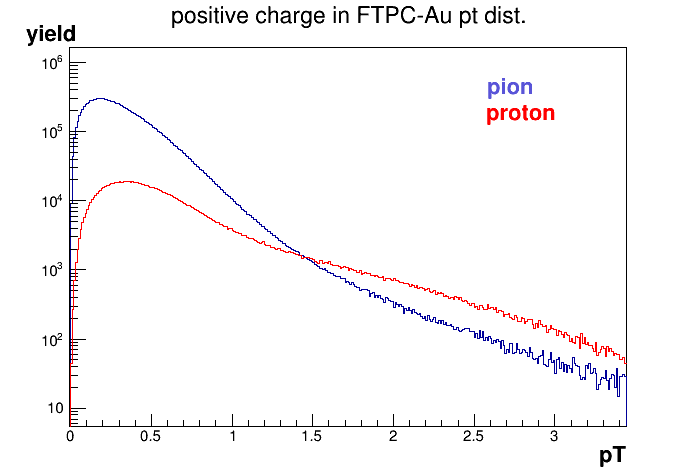
So in the inclusive particle Hijing simulation, the charge ratio deviation from unity comes from the proton at higher pT.
2. MC after GEANT inclusive charge ratio
Note: The plot in this section using Pos/Neg.
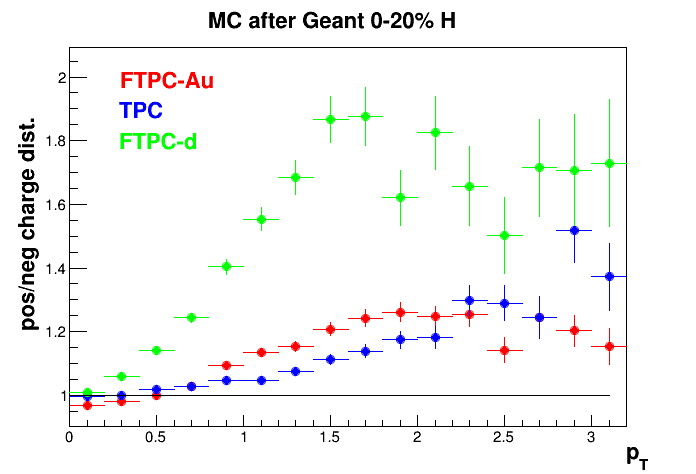
Pos/Neg ratio at FTPC Au-going side:
Hijing: increases as pT increases.
MC after GEANT: increase as pT increase, but much less than Hijing.
Real data: stay constant or slightly decrease at higher pT.
Summary
1. Hijing simulation makes sense.
2. MC after GEANT is more close to the real data than Hijing itself. But it is still different from data.
- yili's blog
- Login or register to post comments