Underlying event activity in p+p 200 GeV with Mono jet for Jet Patch trigger-- 2015-10-07
Motivation:
Followed the study on drupal.star.bnl.gov/STAR/blog/yili/underlying-event-activity-pp-200-gev-2015-09-28-2 (R=0.4, Dijet required, HIgh Tower trigger)
also drupal.star.bnl.gov/STAR/blog/yili/underlying-event-activity-pp-200-gev-mono-jet-2015-10-02-0 (R = 0.6, at least one jet, High Tower trigger)Here R = 0.6, at least one jet, Jet patch trigger
How does underlying event multiplicity, average pT change with Leadiing jet pT?
CMS publication: arxiv.org/abs/1507.07229
CDF publication: arxiv.org/abs/1508.05340
Grant Webb's study on p+p 500 GeV data: drupal.star.bnl.gov/STAR/blog/gdwebb/underlying-event-run-9-pp-500-gev
Zilong Change's study on PYTHIA p+p 500 GeV: drupal.star.bnl.gov/STAR/blog/zchang/underlying-event-study-4
Here is Li Yi's third step to study the underlying event in p+p 200 GeV.
See Master Page: drupal.star.bnl.gov/STAR/blog/yili/master-page-underlying-event-pp-200-gev
Data:
p+p 200 GeV
Run 12
filetype=daq_reco_MuDst,events!=0,trgsetupname=pp200_production_2012,filename~st_physics,production=P13ib,storage!=hpss,sanity=1
triggerid: 370601, 370611, 370621
for JP0, JP1, JP2
Cuts:
|Vz|<30 cm
|eta|<1
|dca|< 1 cm
NFIt > 20 points
NFit/NFitPossible > 0.52
Track Pt or Tower Et<1000GeV
no pileup removal
anti-kT algorithm
R = 0.6
ghost area 0.01
14M events, found 2.3 M jet events (no jet pT requirement)
Method:
1. Search for jet, identify jet φjet
Both TPC tracks and BEMC towers are used for jet reconstruction by fastjet pacakge.
2. Loop over tracks (charged particles only)
|φ-φjet|<60 degree --> Leading jet direction
|φ-φjet|>120 degree --> "SubLeading" jet direction
60 degree<|φ-φjet|<120 degree --> transverse direction
For the two transverse directions, the one with larger pT sum of the charged particle is defined as TranMax. The other is TranMin.
3. Sum the multiplciity in various directions.
Calucate the average pT in various directions.
Result:
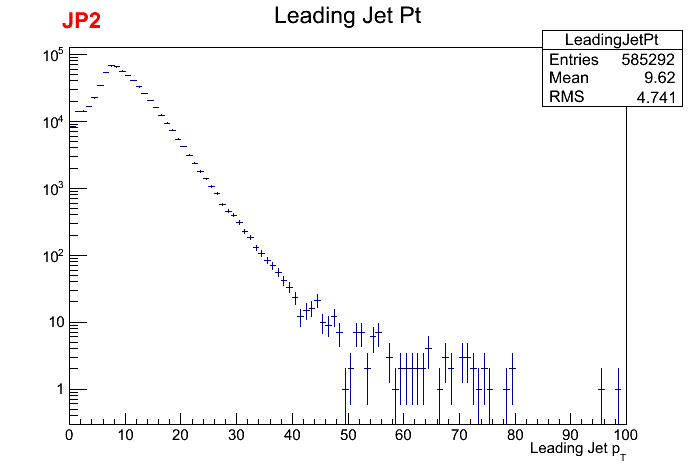
1. Leading jet Pt Distribution:
.png) |
 |
2. Ntrk in Leading Jet Direction vs Leading Jet Pt
(number of charged particles in |φ-φjet|<60 degree, including the particles belongs to leading jet) :
.png) |
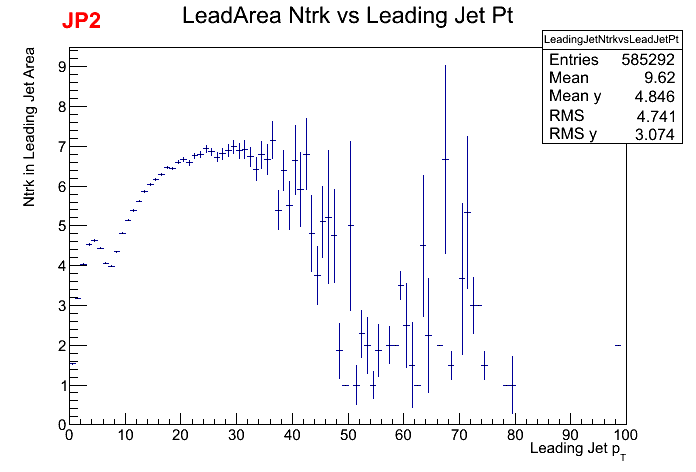 |
Here we can see that the trigger effect of JP2 shows a little bump at pt 5-10 GeV/c.
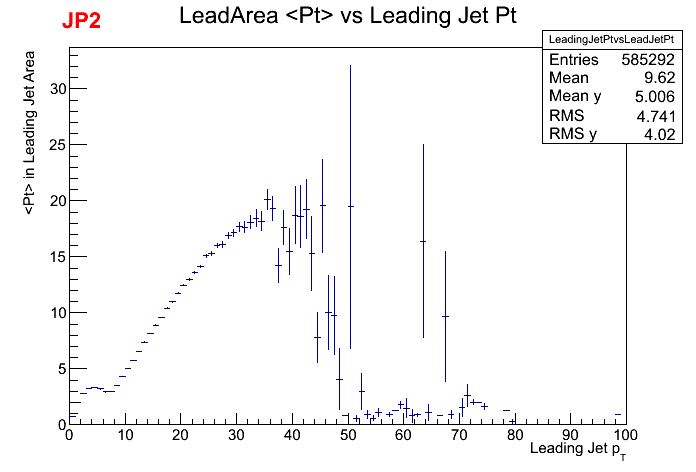
3. Sum of charged particle pT in Leading Jet Direction vs Leading Jet Pt. The title in the plot was wrong: it is sum not mean <pT>.
(in |φ-φjet|<60 degree, including the particles belongs to leading jet) :
.png) |
 |
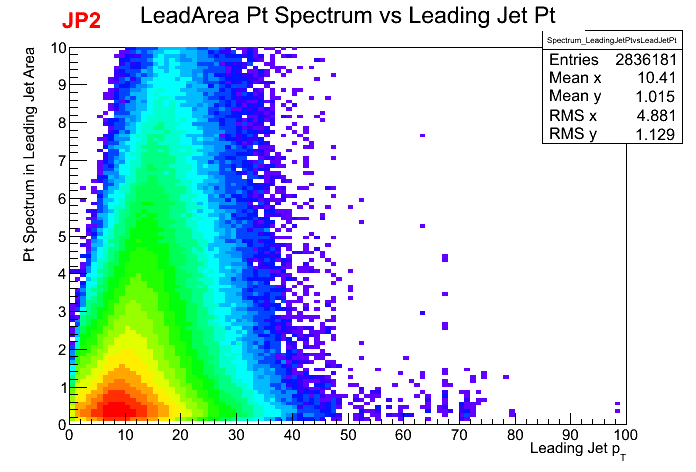
4. charged particle pT distribution in Leading Jet Direction vs Leading Jet Pt
(in |φ-φjet|<60 degree, including the particles belongs to leading jet) :
.png) |
 |
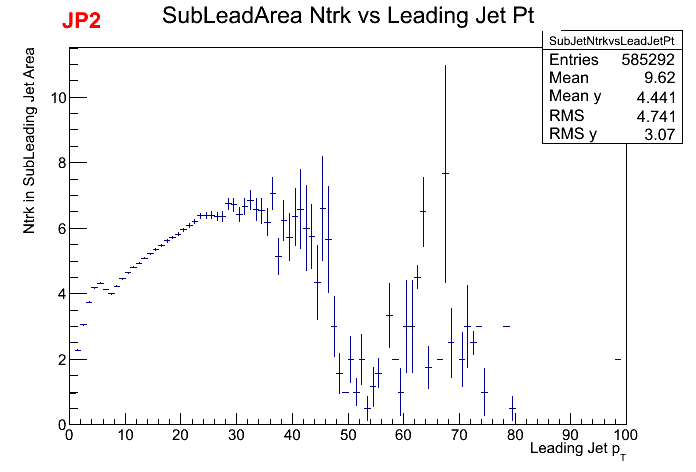
5. Ntrk in recoil side of Jet Direction vs Leading Jet Pt
(number of charged particles in |φ-φdijet|>120 degree, does not requiring subleading existence ):
.png) |
 |
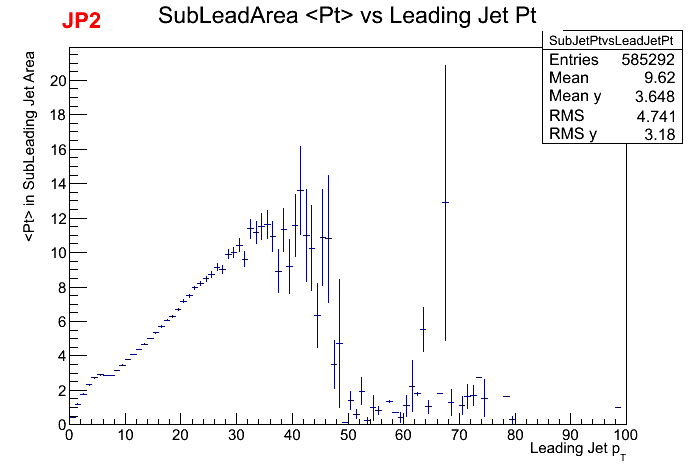
6. Sum of particle pT in recoil side of Jet Direction vs Leading Jet Pt. The title in the plot was wrong: it is sum not mean <pT>.
(number of charged particles in |φ-φdijet|>120 degree, does not requiring subleading existence ):
.png) |
 |
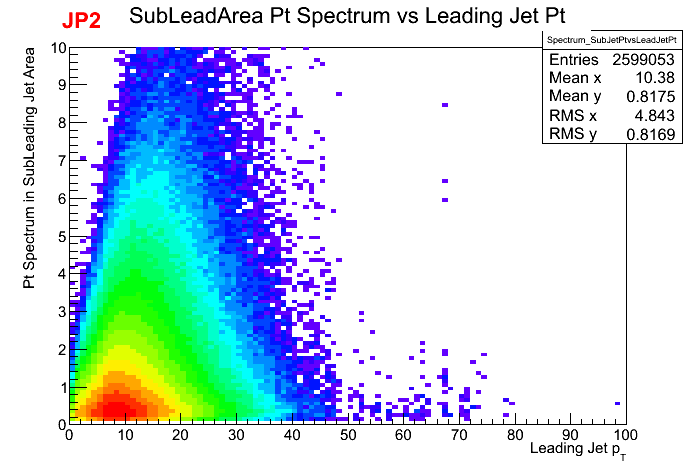
6. Charged particle pT distribution in recoil side of Jet Direction vs Leading Jet Pt
(number of charged particles in |φ-φdijet|>120 degree, does not requiring subleading existence ):
.png) |
 |
7. Ntrk in Transverse direction vs Leading Jet Pt
.png) |
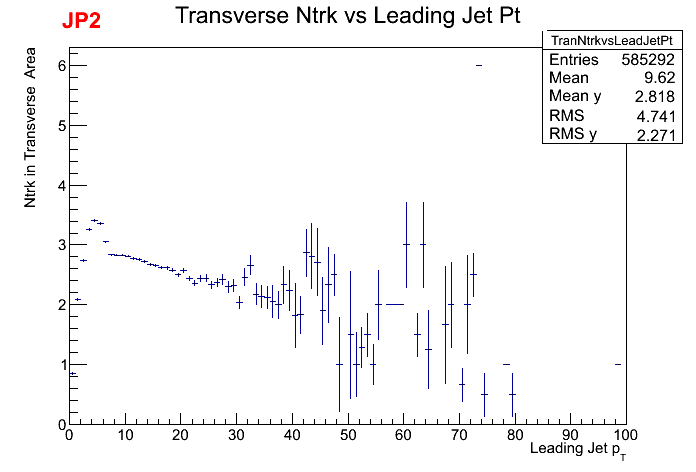 |
The average Tranverse Ntrk is lower for JP2 only.
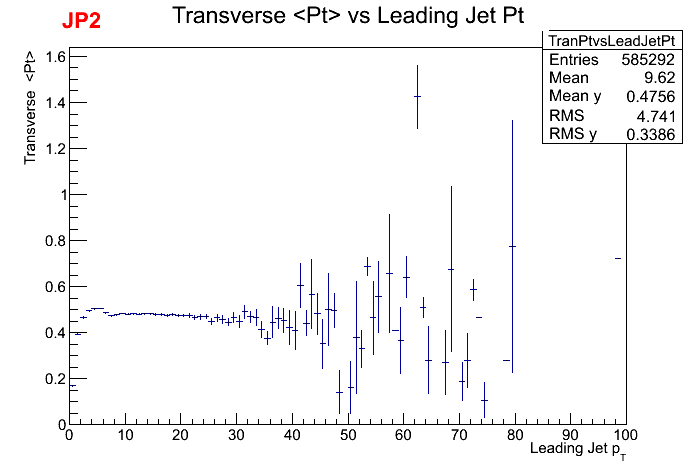
8. <pT> in transverse direction vs Leading Jet Pt
.png) |
 |
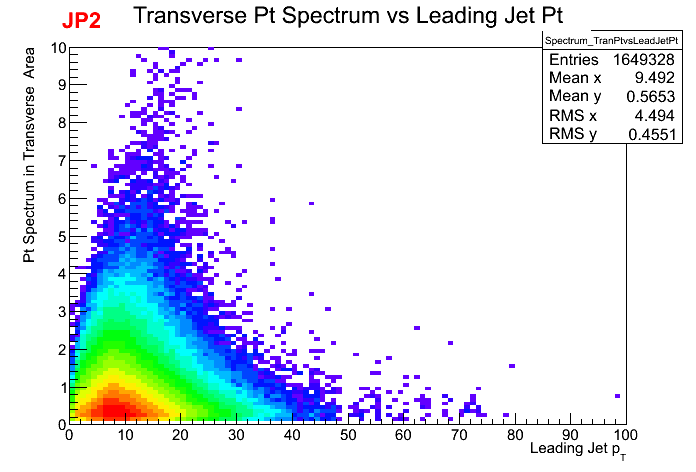
9. charged particle pT distribution in transverse direction vs Leading Jet Pt
.png) |
 |
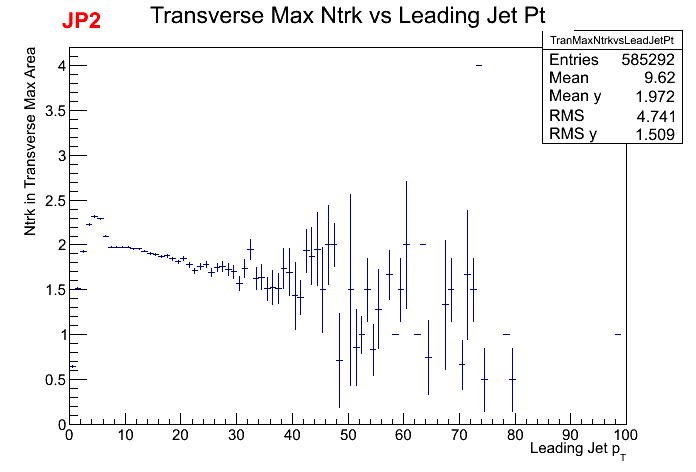
10. Ntrk in TranMax vs Leading Jet Pt
.png) |
 |
11. <pT> in TranMax vs Leading Jet Pt
.png) |
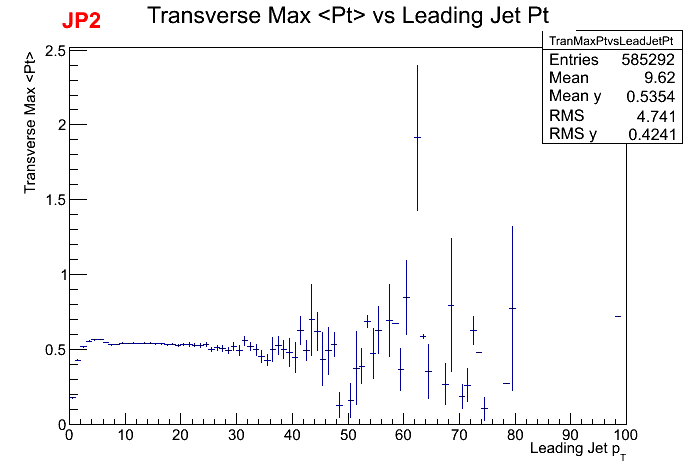 |
Different JP triggers have same <pT> for TranMax
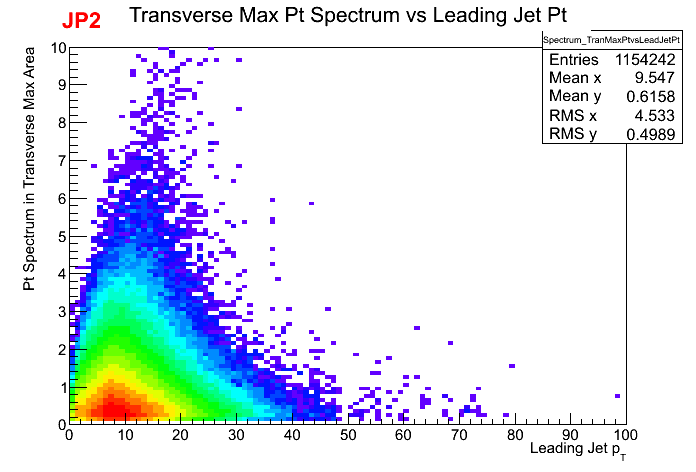
12. charged particle pT distribution in TranMax vs Leading Jet Pt
.png) |
 |
13. Ntrk in TranMin vs Leading Jet Pt
.png) |
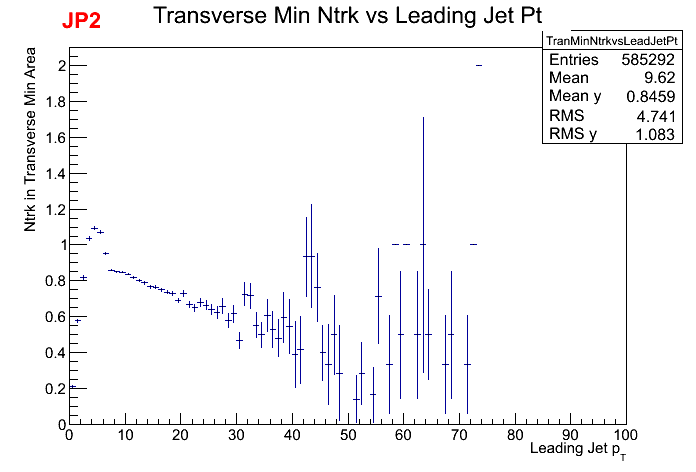 |
Similar TranMin Ntrk for JP2 and JP0+JP1+JP2
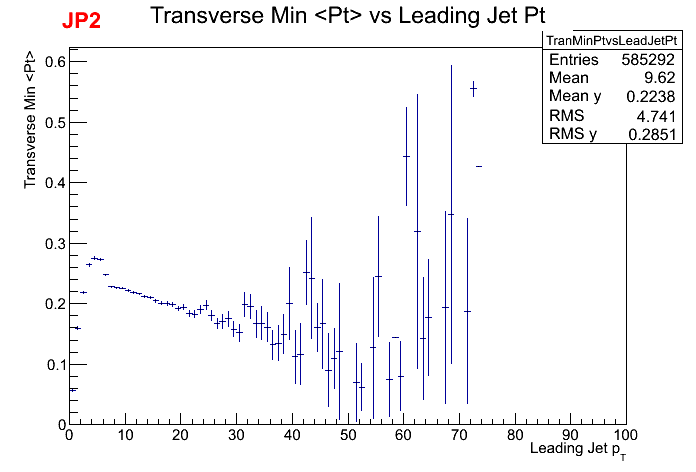
14. <pT> in TranMin direction vs Leading Jet Pt
.png) |
 |
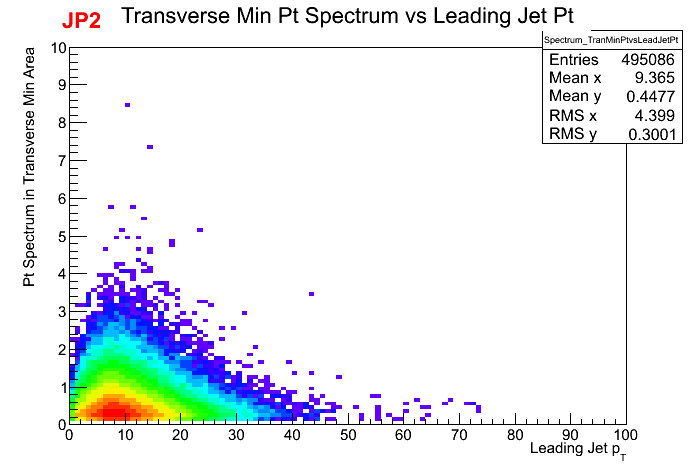
15. charged particle pT distribution in TranMin vs Leading Jet Pt
.png) |
 |
- yili's blog
- Login or register to post comments
