- yuxip's home page
- Posts
- 2015
- 2014
- December (2)
- November (1)
- October (2)
- September (6)
- August (2)
- July (1)
- June (3)
- May (4)
- April (1)
- March (2)
- 2013
- December (1)
- November (1)
- October (3)
- September (3)
- August (2)
- July (1)
- June (2)
- May (1)
- April (3)
- March (1)
- February (1)
- January (1)
- 2012
- 2011
- My blog
- Post new blog entry
- All blogs
Gain curves from 01/26 LED data
Updated on Fri, 2013-01-11 20:42. Originally created by yuxip on 2011-01-20 15:25.
Following are the gain curves from LED runs that we took on Jan.26th.
Conditions: Magnet Full Field Polarity B, DX Current = 145 A (injection)
LED ADC =255 3Hz. FMStest_cl setup Th1~40-75 for both large/small cells
About 1000 events in each run.
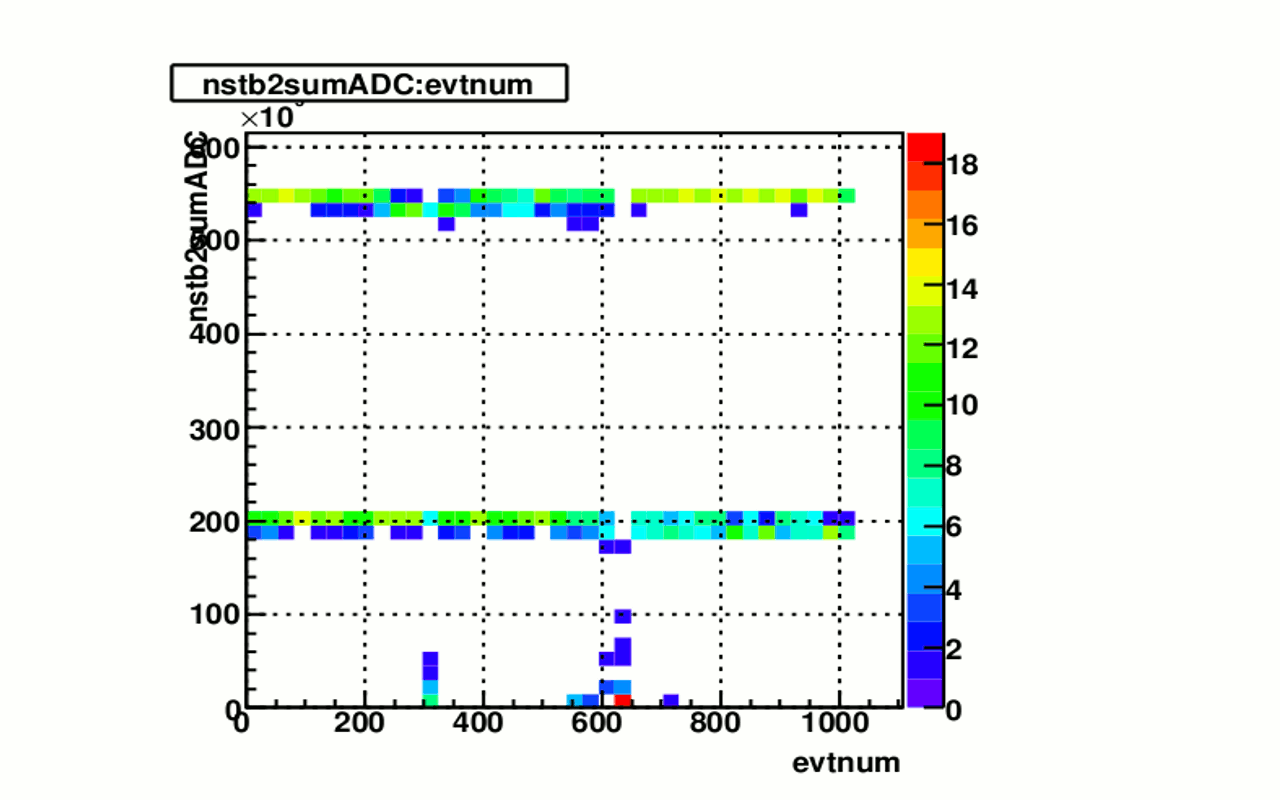
One of the things I did when plotting ADC spectrum is that I made a cut on sumADC of one of the four nstb modules( as can be seen on the event display). By doing so,hopefully I can get rid of the lower peaks for most of the cells

figure 1. (run12016005 sumADCcut: nstb2>500k)
The curves are fiited to MeanADC=exp(a*(HV^2)+b*(HV)+c) accroding to Jingguo's parameterization.
»
- yuxip's blog
- Login or register to post comments
