- yuxip's home page
- Posts
- 2015
- 2014
- December (2)
- November (1)
- October (2)
- September (6)
- August (2)
- July (1)
- June (3)
- May (4)
- April (1)
- March (2)
- 2013
- December (1)
- November (1)
- October (3)
- September (3)
- August (2)
- July (1)
- June (2)
- May (1)
- April (3)
- March (1)
- February (1)
- January (1)
- 2012
- 2011
- My blog
- Post new blog entry
- All blogs
averaged 3 parameters of the gain curve
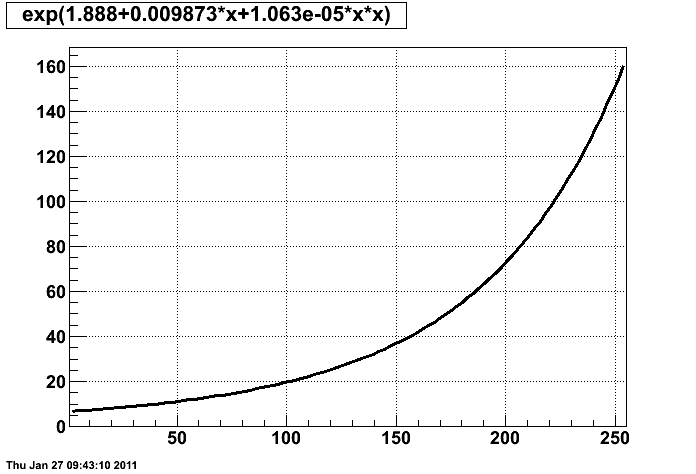
Based on the gain curves from LED runs 12016005~12016034( with DX current= 145A and STAR magnet on at full field B polarity), we calculated averaged 3 parameters that will be used in the beginning of the iterations based on trigger rate.
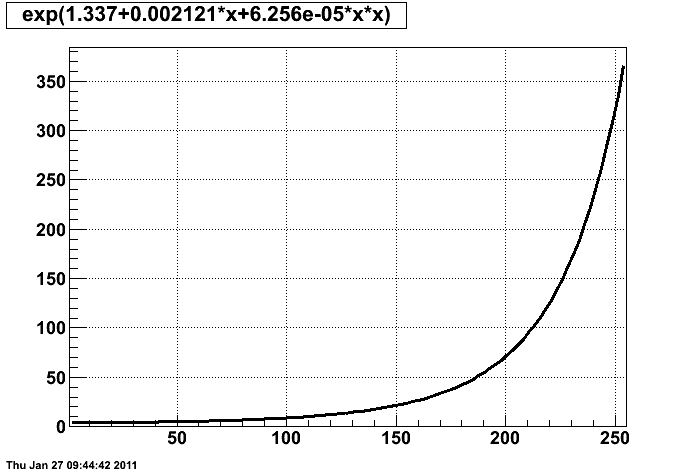
We were able to identify PSU bases v.s. Yale bases from the distribution of fitting parameters, as shown below. Therefore we'll provide different averaged parameters accroding to the base type. All of the large cells will have identical parameters for now.
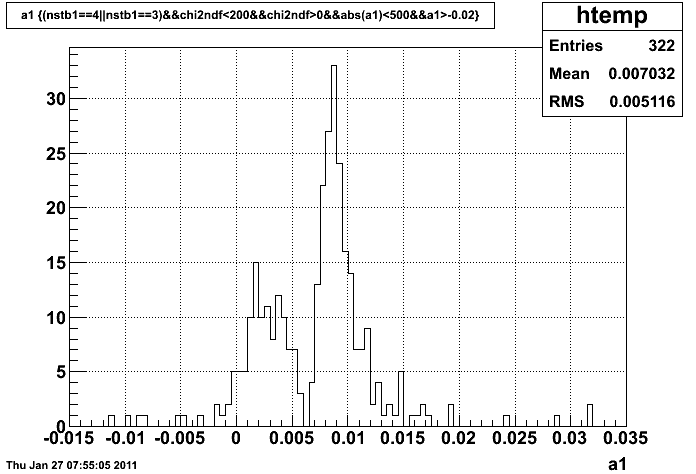
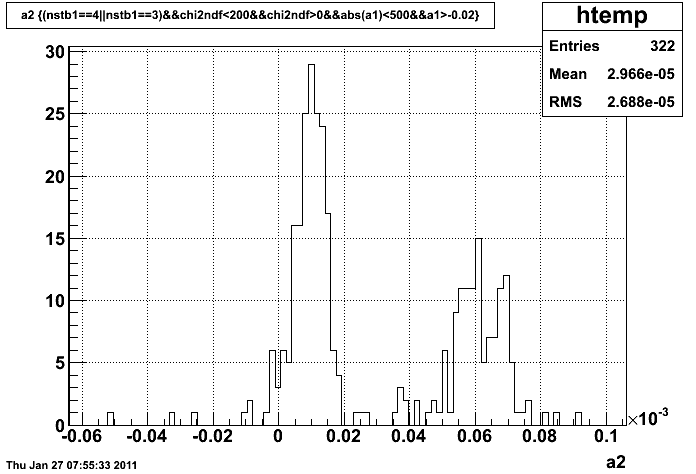
figure 1. ( distribution of a1 and a2 for all of the small cells, where gain=exp(a0+a1*HV+a2*HV*HV) )
By cutting on a2, we could classify the small cells into two famlies.
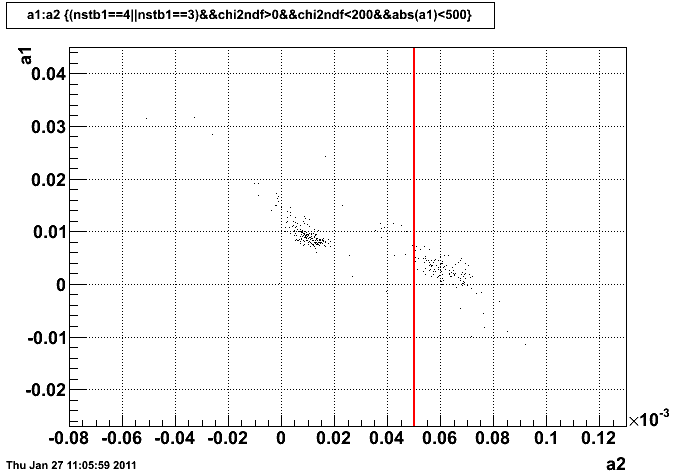
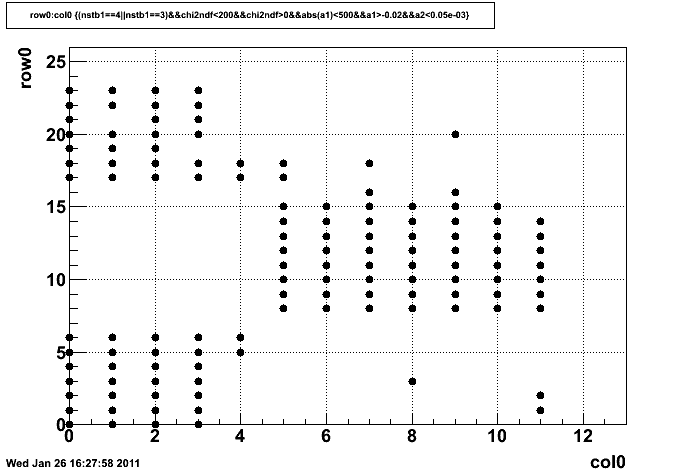
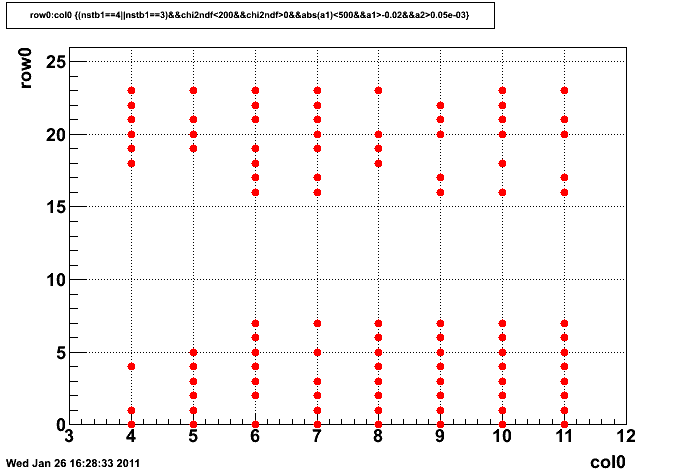
figure 2. PSU bases (a2<0.05e-03) figure 3. Yale base (a2>0.05e-03)
Here north and south halves are overlapped.
large cells:
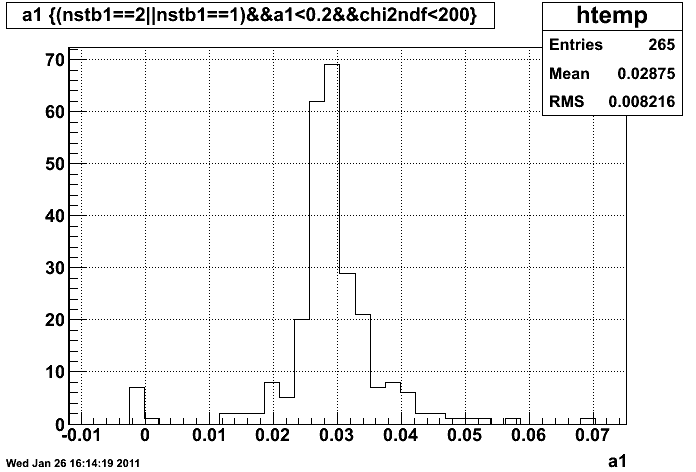
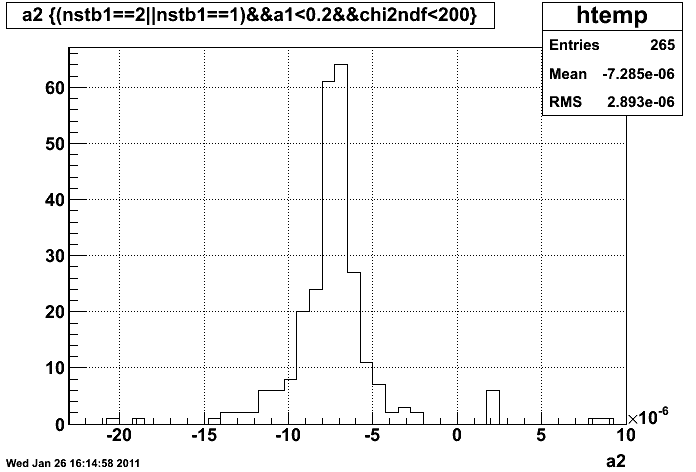
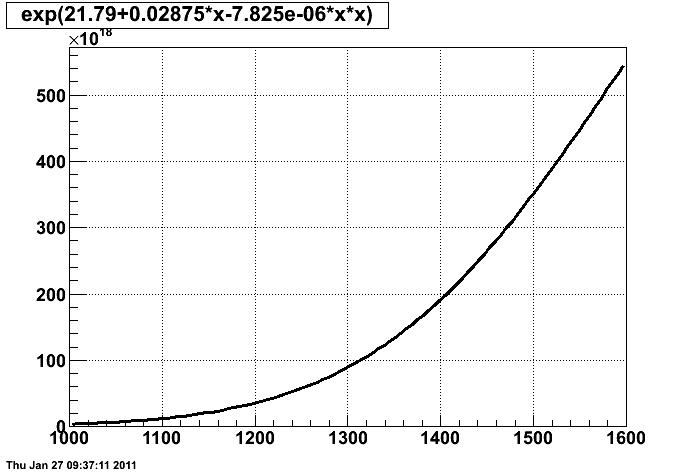
Final parameters:
large cells: a0 = 21.79, a1=0.02875, a2= -7.825e-06 small cells with psu bases: a0 = 1.888, a1=0.009873, a2= 1.063e-05
small cells with Yale bases: a0= 1.337, a1= 0.002121, a2=6.256e-05
Following shows the variation of a1 and a2 across cells
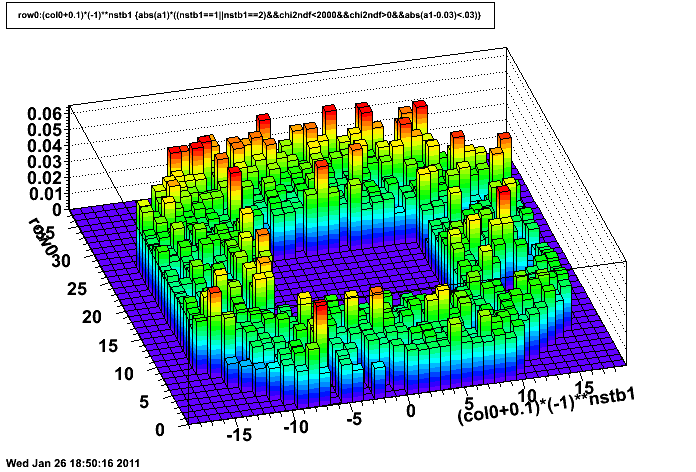
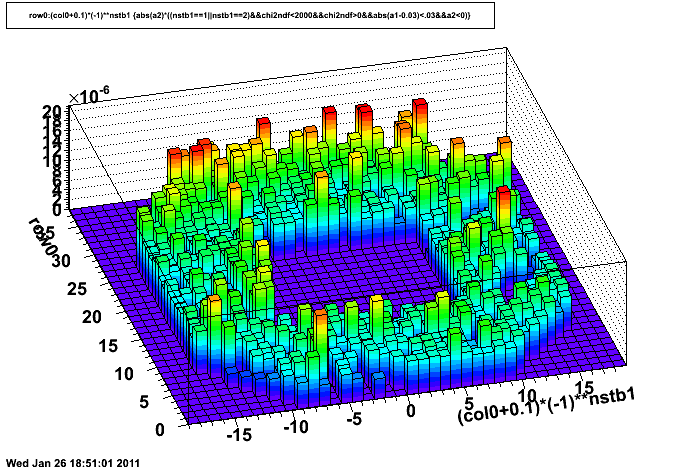
a1@large cells a2@large cells
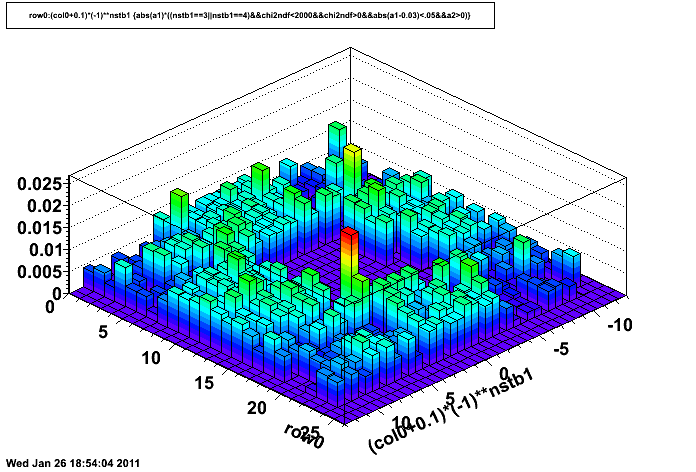
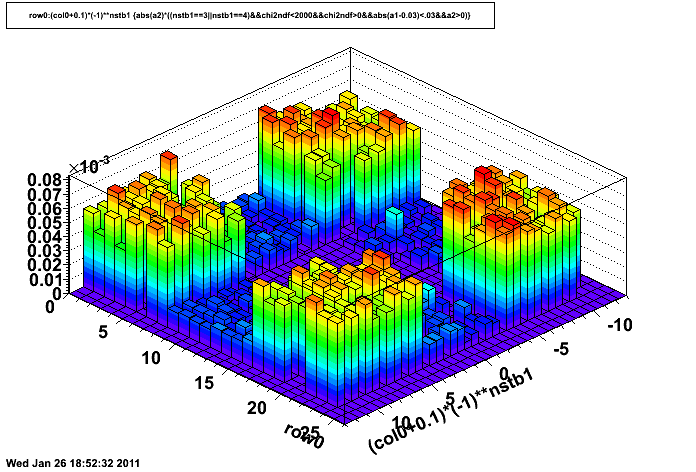
a1@small cells a2@small cells
- yuxip's blog
- Login or register to post comments
