- yuxip's home page
- Posts
- 2015
- 2014
- December (2)
- November (1)
- October (2)
- September (6)
- August (2)
- July (1)
- June (3)
- May (4)
- April (1)
- March (2)
- 2013
- December (1)
- November (1)
- October (3)
- September (3)
- August (2)
- July (1)
- June (2)
- May (1)
- April (3)
- March (1)
- February (1)
- January (1)
- 2012
- 2011
- My blog
- Post new blog entry
- All blogs
mass dependence of relative beam intensity (modified)
1. As was suggested, the cuts for pion candidates need to be studied when examine the effect of beam intensity and LED corrections within a fill.
Pion mass posted in the previous blog showed a considerable background in the high mass region, since there was no special cut to deal with
this probem and I was mixing pions with different energy (E12>20). The current analysis has been focused on pions from large cells and with a
narrow energy window ( 15<E12<25 ).
Further observation showed that a cut on opening angle is also necessary to reduce the background. This cut is estimated as follows:
Note that sin( phi / 2 ) = m / ( E*sqrt ( 1 - Z^2) ) (1), where phi is the opening angle and Z is energy sharing abs(E1-E2) / (E1+E2). In principle Z distribution
is flat and has a upper limit, which is the velocity of pion ( ~ 1). But the actual Z distribution observed in experiment is affected by background
as well as detector acceptance. Here is an example:
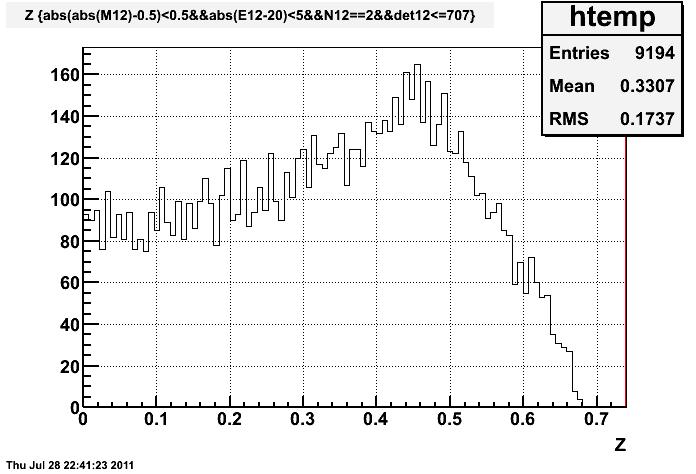
figure 1. Z distribution of pion candidates from large cells.
b). opening angle distribution
We see that the actual Z distribution has a small bump in the higher Z region, which is caused by falsely combined photon pairs. These
pairs usually have a large opening angle accroding to equation (1) and will leak into the high mass region of pion spectrum. The upper limit
is less than 1 due to finite acceptance.
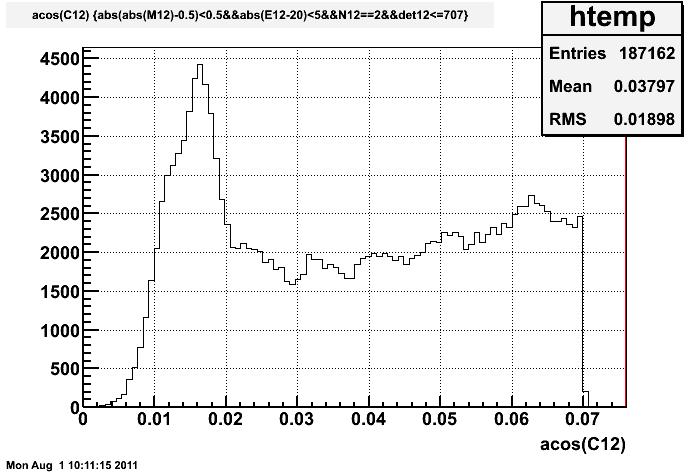
From e.q (1), pairs with the largest opening angle come from the most asymmetric decays that can be observed. Given the current energy ( 20GeV )
and Zmax (0.7) from figure 1, the maxium opening angle is about 0.02 rad, which is smaller than the cone size used for photon clustering. So an
opening angle cut is necessary to remove mismatched pairs. Here is an example that shows the effect of this cut:
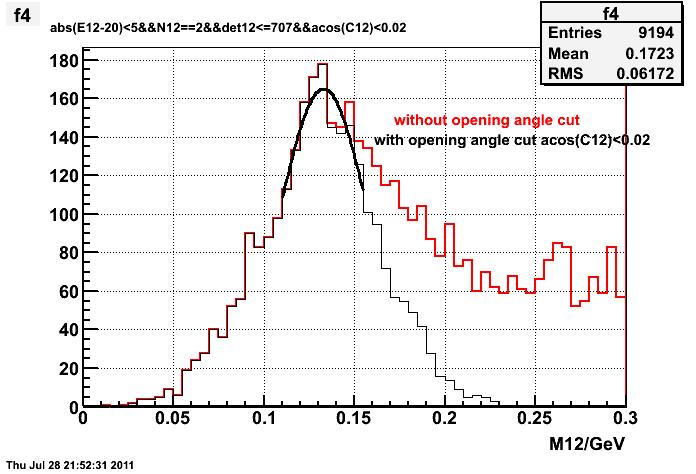
figure 2. opening angle cut
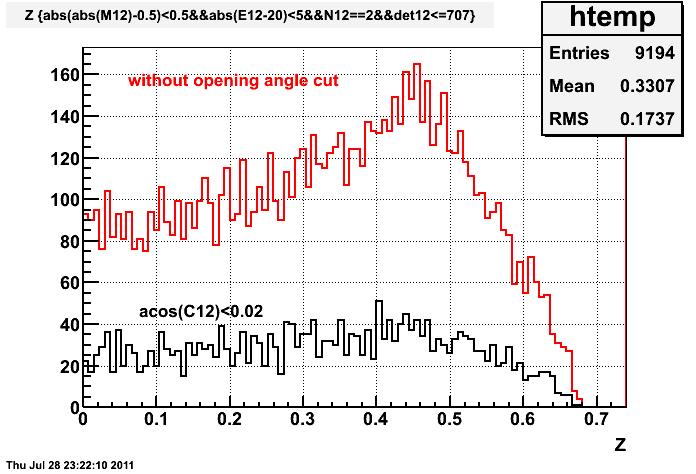
figure 3. Z distribution before / after opening angle cut
3. With the above cuts, I reanalyzed the data from fill15376. -- pion mass fit in large cells
a). large cells, no cuts on pseudorapidity: before applying LED correction , after
b). large cells, 2.7< eta < 2.9 before applying LED correction, after
c). large cells, 2.9 < eta < 3.0 before applying LED correction, after
d). large cells, 3.0 < eta < 3.2 before applying LED correction, after
e). small cells, no eta cut before , after --pion mass fit in small cells
Groups:
- yuxip's blog
- Login or register to post comments