- yuxip's home page
- Posts
- 2015
- 2014
- December (2)
- November (1)
- October (2)
- September (6)
- August (2)
- July (1)
- June (3)
- May (4)
- April (1)
- March (2)
- 2013
- December (1)
- November (1)
- October (3)
- September (3)
- August (2)
- July (1)
- June (2)
- May (1)
- April (3)
- March (1)
- February (1)
- January (1)
- 2012
- 2011
- My blog
- Post new blog entry
- All blogs
time dependent gain correction by LED events
Based on the original time dependent correction scheme, I tried a slightly different way to calculate "gcorr" for a given event.
Previously the code makes averages for every 40 LED events, and assigns a "gcorr" to a real event according to the mean ADC of its 40 neighboring LED pulses ( gcorr = nominal gcorr*( mean LED adc of the base run / mean adc of 40 LED neighbors) ). This method did improve our physics results, especially in the number of etas at higher enegy. It means time-dependent correction is indeed necessary to capture the short term gain drift of the tubes.
It is also interesting to look at the effect of a event-by-event gain correction calculated from a single LED neighbor. There were concerns that it'll be dominated by noise because we are looking at the very high frequency component of the gain variation, or variations in the intensities of the pulse. But so far the physics result is not complaining at this point.
Here I am showing the results from 9 runs on day 80, these runs are:
12080001
12080004
12080010
12080011
12080012
12080017
12080018
12080020
12080052
About 10M events in total.
12080001 was used as the base run. The mean adc of LED events during this run was calculated for each cell, and was set as the nominal LED adc that corresponds to the initial gain corrections found here:
www.star.bnl.gov/protected/spin/heppelmann/tmp/Mar-30a/FpdCorr.txt
Then a new correction factor has been calculated for each cell at every event (including those from run12080001), according to the formula: gcorNew = gcor*( mean LED adc of the base run / adc of most adjacent LED event ).
Here is a plot that shows the adc distribution of LED events for one cell in the base run:
.gif)
An example of a systematic gain drift ( or possibly intesity variation of the LED pulse ).
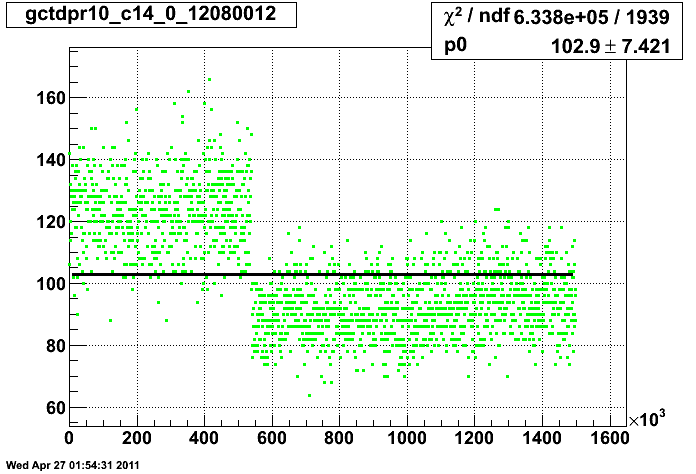
A plot of the mean adc over 40 neighbors for the same cell can also be found here in the bottom.
Here are some phyics plots like the ones that Steven.H has been showing: www.star.bnl.gov/protected/spin/yuxip/JchkSH12080_9_i1.pdf
To make fair comparisons, I also analyzed the same data set with previous t-dependent correction method: www.star.bnl.gov/protected/spin/yuxip/JchkSHH12080_9_i1.pdf
and a full mass iteration on all of the 9 runs, without t-dependent correction: www.star.bnl.gov/protected/spin/yuxip/JchkS_12080_9_i1.pdf
The improvements of the above two t-dependent correction schemes are dramatic compare to the last one. Distinctions of the results between these two methods are subtle.
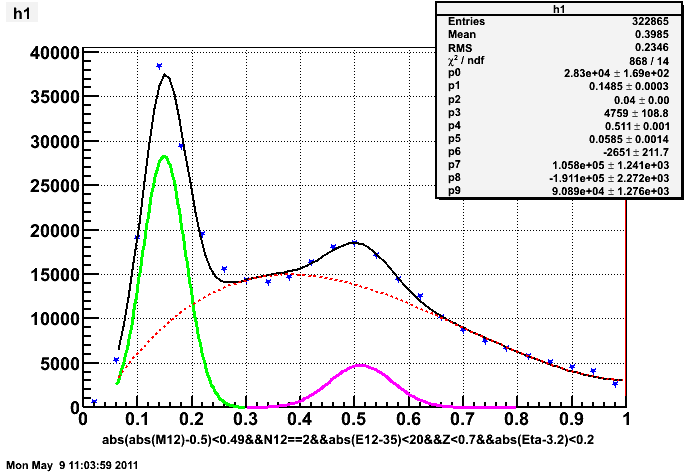
Here are some fits to the mass spectrum, mostly on the large cells:
1. at 35 GeV, pseudorapidity = 3.2, new gcorr method:
same energy and pseudorapidity, previous t-dependent gcorr method:
.gif)
same energy and pseudorapidity, "gcorr" calculated from a full mass iteraion
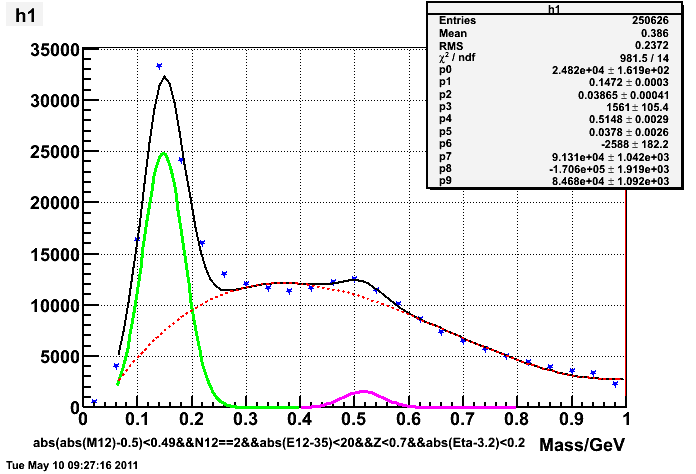
2. at 55GeV, pseudorapidity = 3.2, new gcorr method:
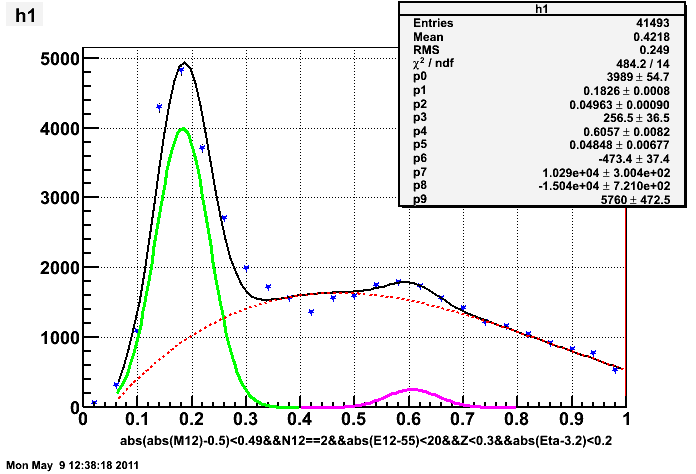
notice that I applied smaller Z (energy sharing) cut to reduce the background at higher mass region.
same energy and pseudorapidity, previous t-dependent gcorr method:
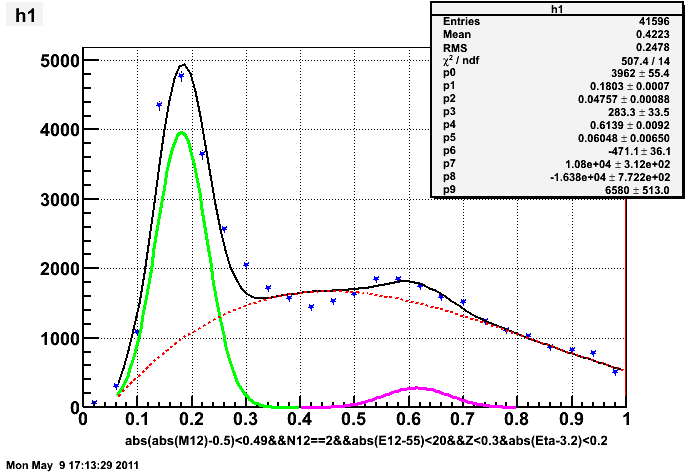
same energy and pseudorapidity, "gcorr" calculated from a full mass iteraion:
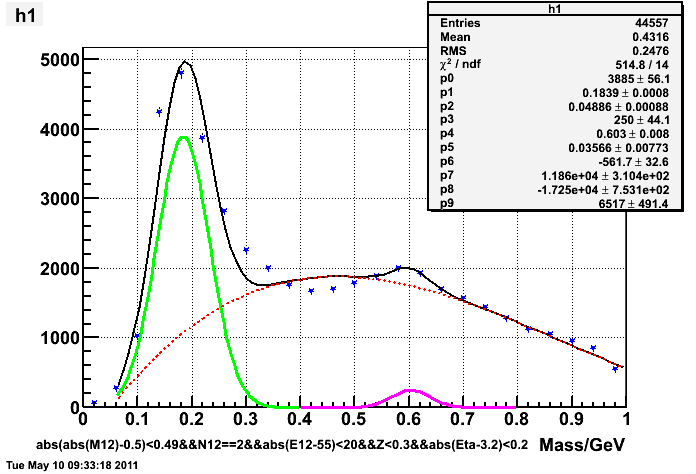
The fit to mass spectrum has not been very good, partly because I have not been able to describe the background very well, especially in the valley between pion and eta.
Another problem yet to be solved is how to deal with the slow component of gain shfit in the data set that expands over days. Because it has been found that most of the systematic drifts in the adc of LED pulses do not reflect the actual variation of the gains, i.e. it was the intensity of the pulse that was slowly varying instead of the gain.
Probably a simple way to get around this is to break up the dataset into short ones and calculate gcorr based on a combine mass iteration + t-dependent correction.
Nonetheless, it is also not impossible to figure out a way to describe the pulse shifting and make corrections to it. Since each group of (18?) cells is fed by one LED pulser, we can plot the LED adc of these cells belonging to the same group on top of each other, as a function of run# over few days, and fit to find the common mode of their "gain drifting" , which largely reflects the variation of LED pulses rather than an actual change in the gain of individual tubes.
I tried to find a map of pulser deployment, and ended up with one like this:
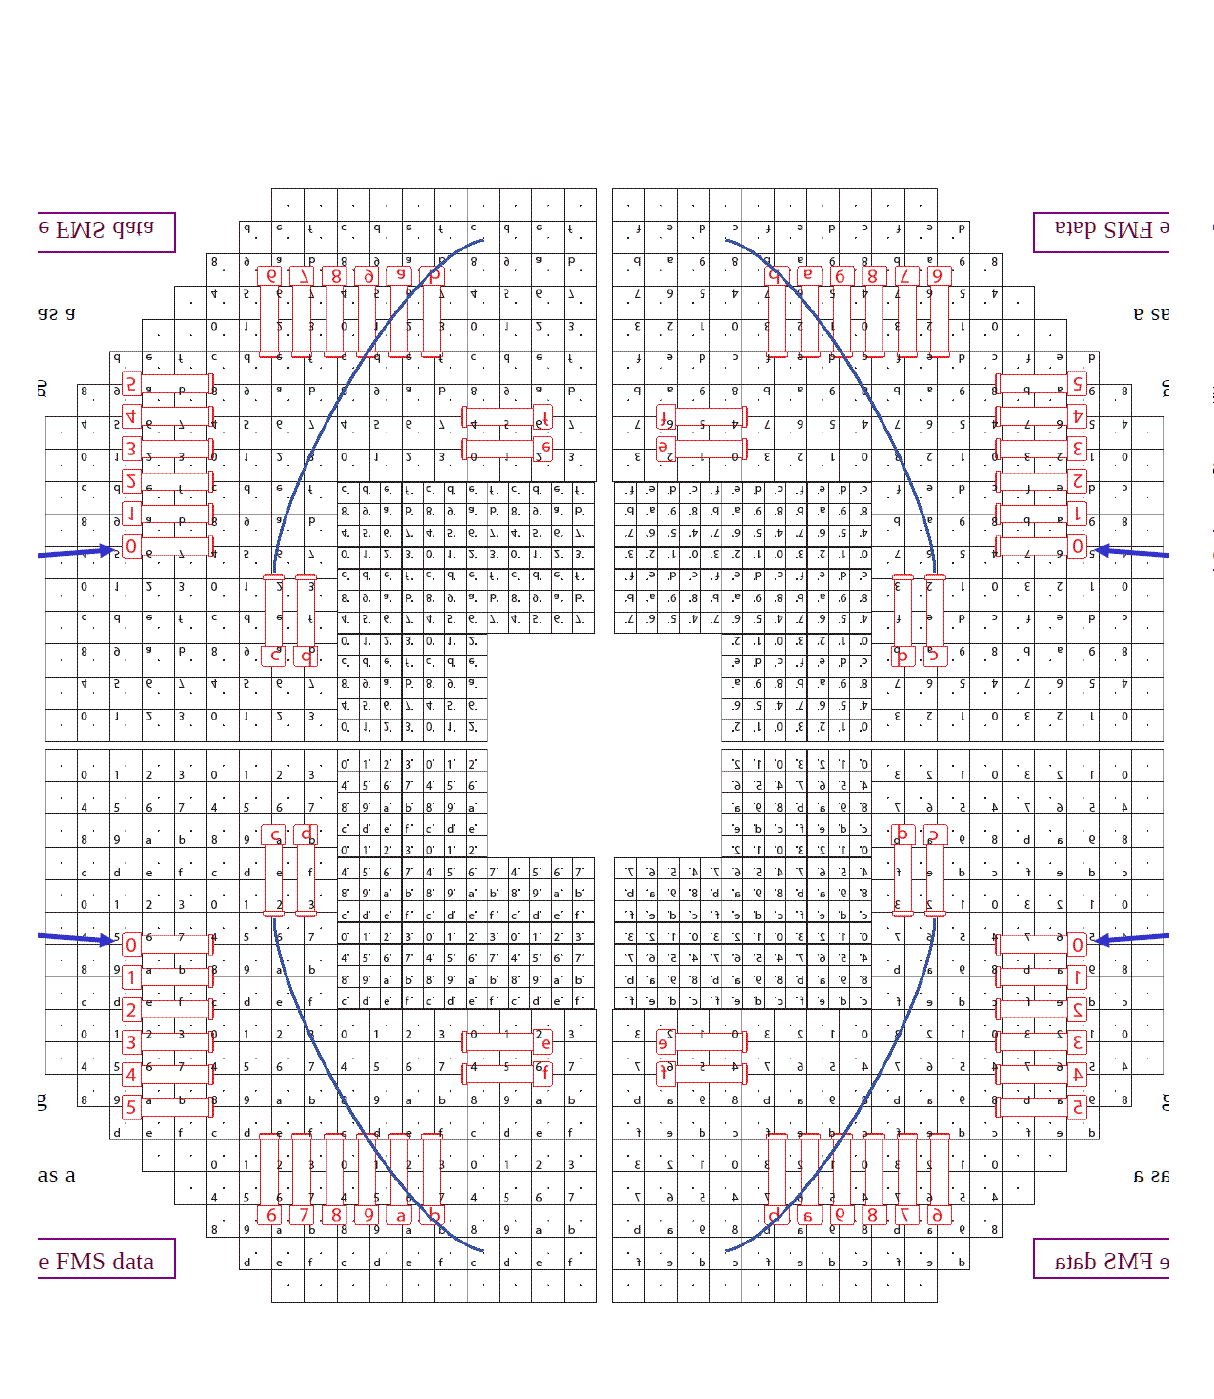
I grabbed this from Andrew Gordon's talk in FMS Review 2009. Since originally it only showed the map of a quadrant, I made mirror images to produce the rest of the three.If this is correct, then all the cells that have the same hex number within the same quadrant will be connected to one pulser. And I can proceed to the next step in trying to find the pulse shifting.
- yuxip's blog
- Login or register to post comments
