- yuxip's home page
- Posts
- 2015
- 2014
- December (2)
- November (1)
- October (2)
- September (6)
- August (2)
- July (1)
- June (3)
- May (4)
- April (1)
- March (2)
- 2013
- December (1)
- November (1)
- October (3)
- September (3)
- August (2)
- July (1)
- June (2)
- May (1)
- April (3)
- March (1)
- February (1)
- January (1)
- 2012
- 2011
- My blog
- Post new blog entry
- All blogs
Run11 A_N / Inclusive pion background study
I've reproduced Run11 500GeV tranverse pp trigger data, with Steve's calibration "FmsCorrD90q5.txt" and asymmetric shower shower funtion implemented.
1) luminosity ratio:
Pion candidates were divided into 6 energy bins with pseudorapidity integrated from (2.5,4.1). I used an energy dependent
mass window in selecting pions. Center of the window was determined by a fit to Gaussian function,window width = 0.1
GeV.
energy bins : 50, 60, 70, 80, 90, 100 GeV
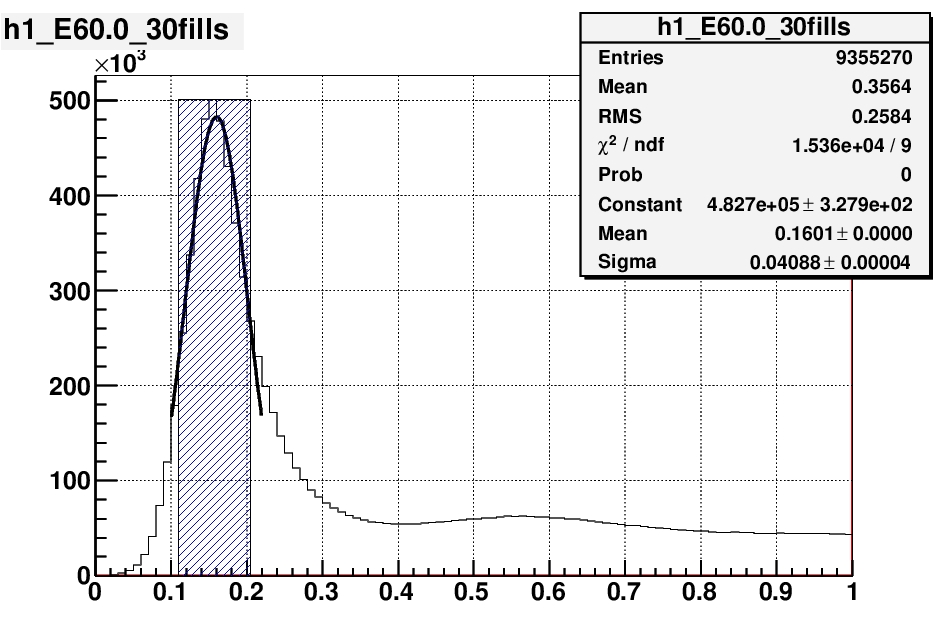
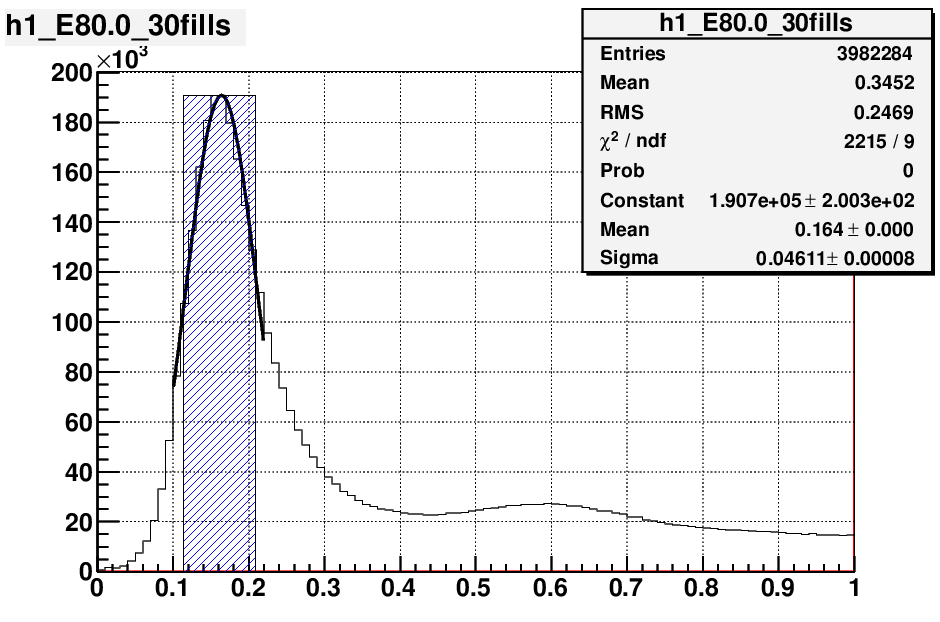
fig.1 a) fig. 1 b)
A linear fit was applied to the raw yield asymmetry vs cos(phi) for each of these 6 energy bins, and the average value of the intercept was calculated.
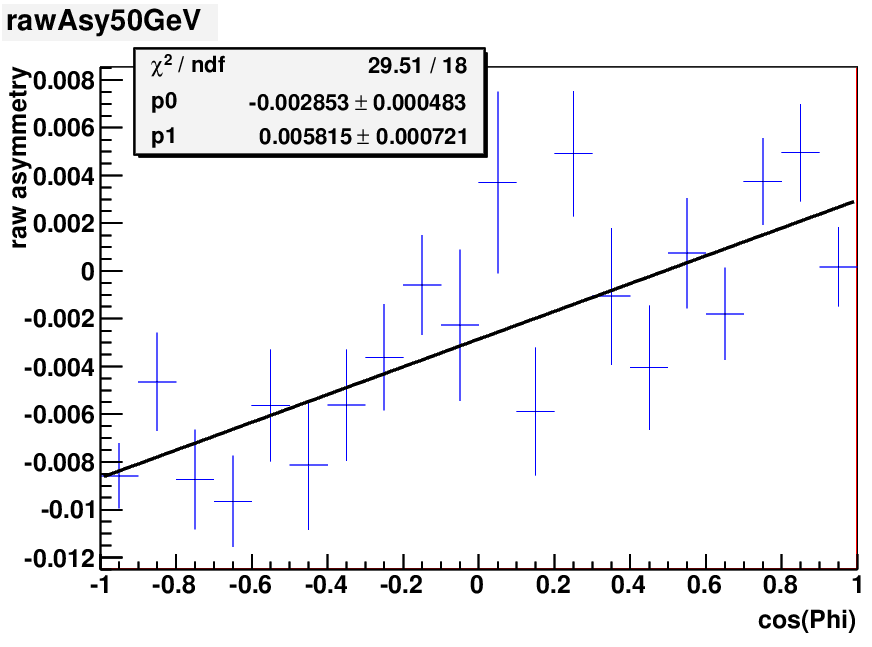
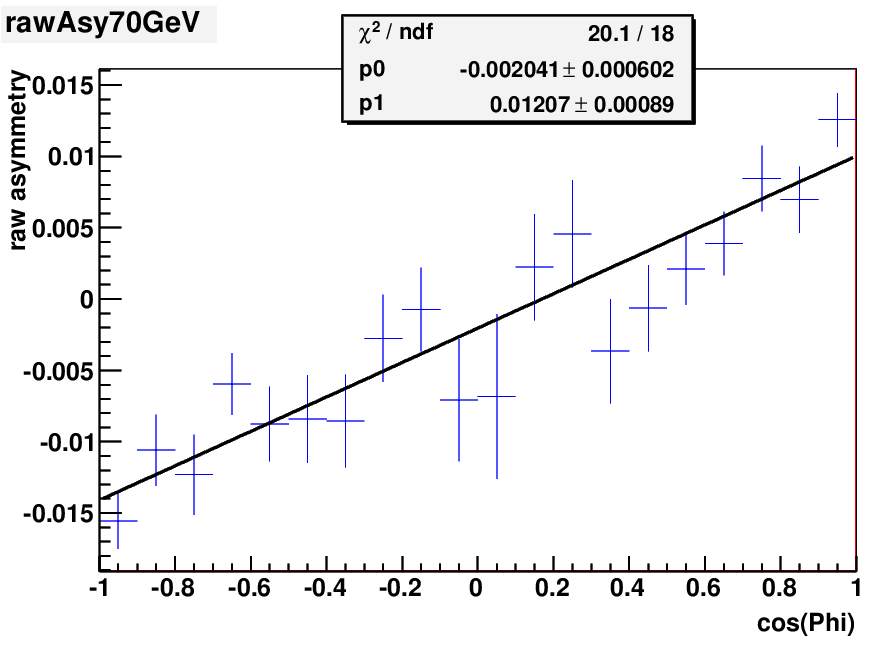
fig. 2 a). fig. 2 b)
Luminosity ratio = ( L_up - L_down ) / ( L_up + L_down ) = ave. intercept / ave. polarization.
Average polaization = 51.6% +/- 6.7% --> luminosity ratio = -0.39% +/- 0.12%. Steve's result is -0.31% +/- 0.05%
2). A_N vs E
Then the raw asymmetry of each energy bin was re-fitted with fixed intercept = 0.39% *51.6% = 0.201%
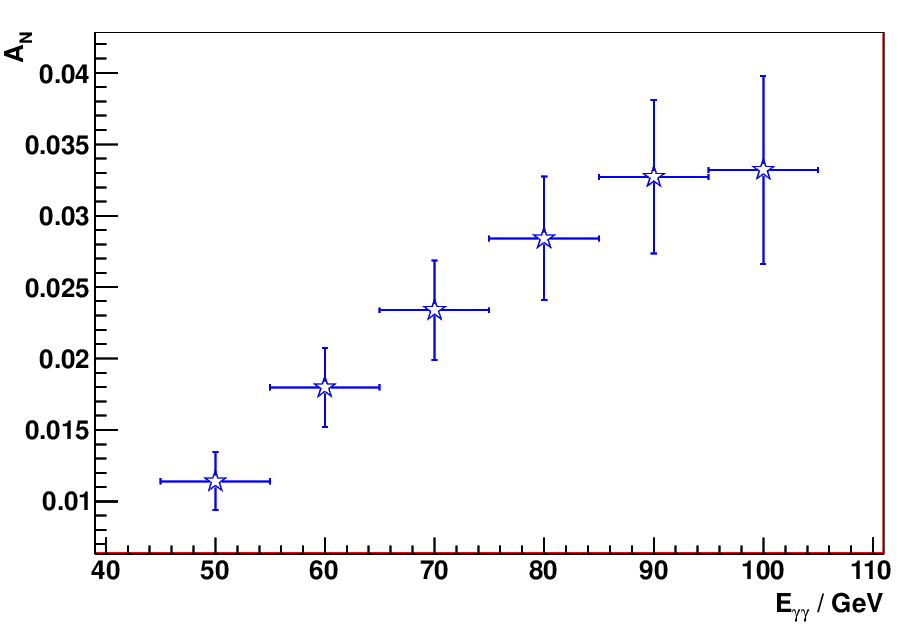
fig. 3
3) A_N vs pT for different energy (x_F)
energy bin = 50, 75, 100 GeV
x_F ~ (0.15,0.25) , (0.25, 0.35), (0.35, 0.45)
pT bin for 50 GeV: 2.0, 2.5, 3.0, 3.5, 4.0, 4.75, 5.75, 6.75 GeV
pT bin for 75 GeV: 2.5, 3.0, 3.5, 4.0, 4.75, 5.75, 6.75, 7.75 GeV
pT bin for 100 GeV: 3.0, 3.5, 4.0, 4.75, 5.75, 6.75, 7.75 GeV
Same as above, I used a varying energy window for each (pT, xF) bin. e.g:
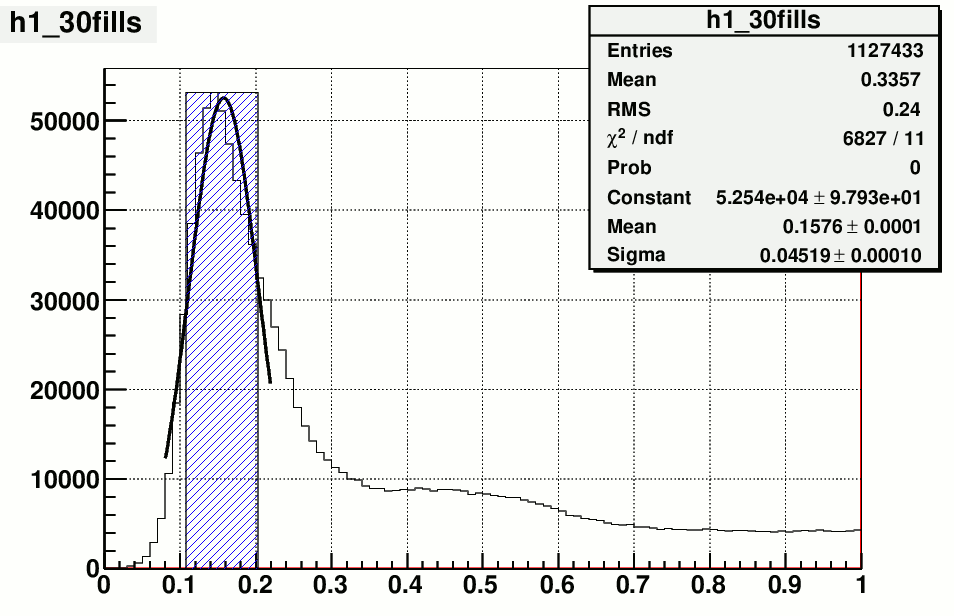
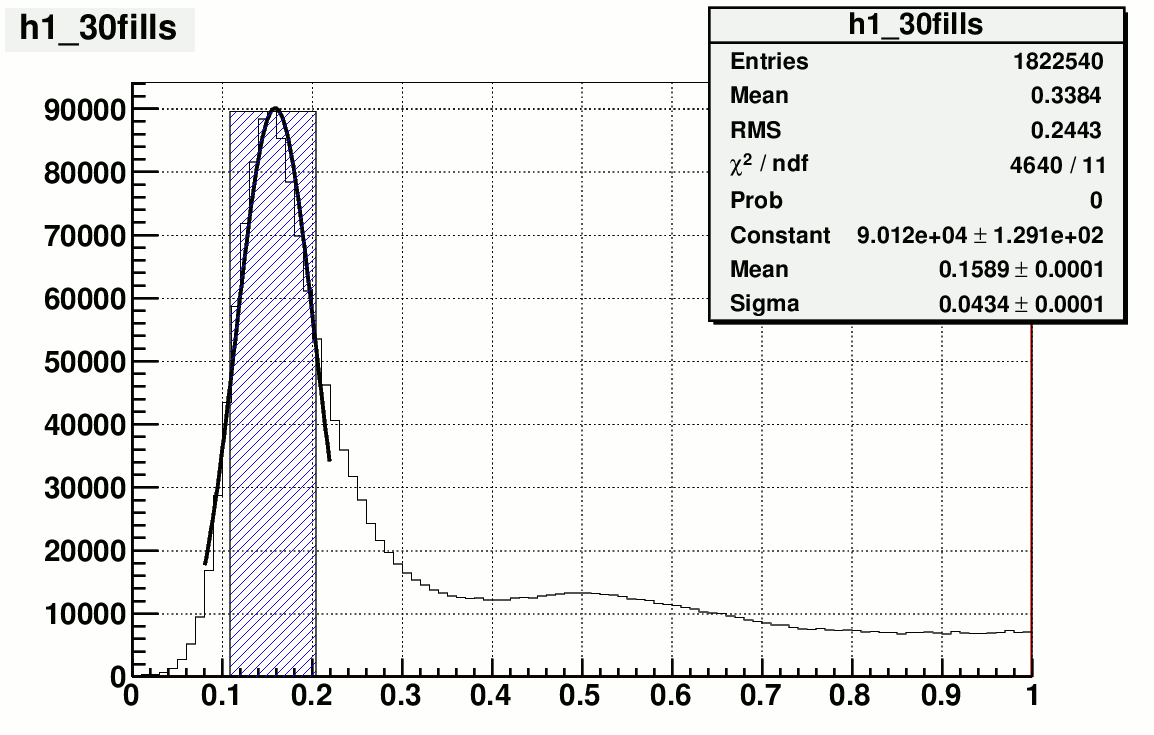
fig.4 M_rr with E = 75 GeV, pT = 2.5 GeV fig.5 M_rr with E = 75 GeV, pT = 3.0 GeV
For each (x_F, pT) bin, a linear fit to raw yield vs cos(phi) was applied, with intercept being fixed at the same value as above.
.gif)
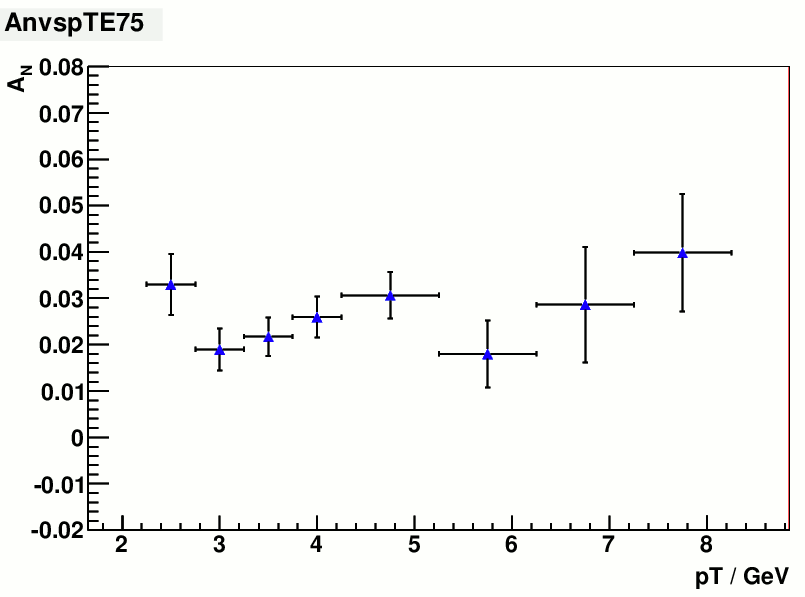
fig. 6 A_N vs pT for 0.15 < x_F < 0.25 fig. 7 A_N vs pT for 0.25 < x_F < 0.35
.gif)
fig. 7 A_N vs pT for 0.35 < x_F < 0.45
I am also looking into the possibility of constructing the backgroud shape for the "inclusive" pion sameples. Thses pions were reconstructed by pairing up photons
one by one while allowing for one photon being paired up with multiple others within the same event. Therefore there is no isolation requirement on the recontructed
pions. Both the yield and background level were increased by a lot. e.g.
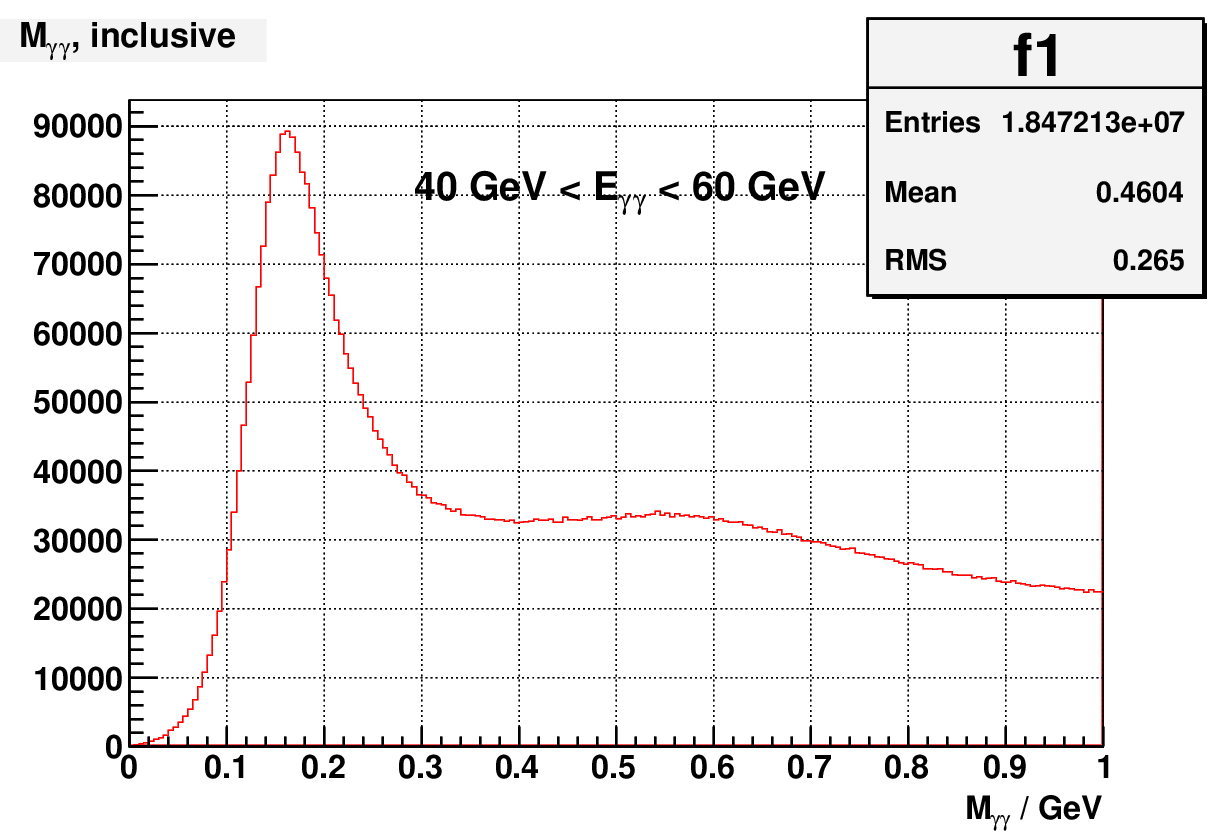
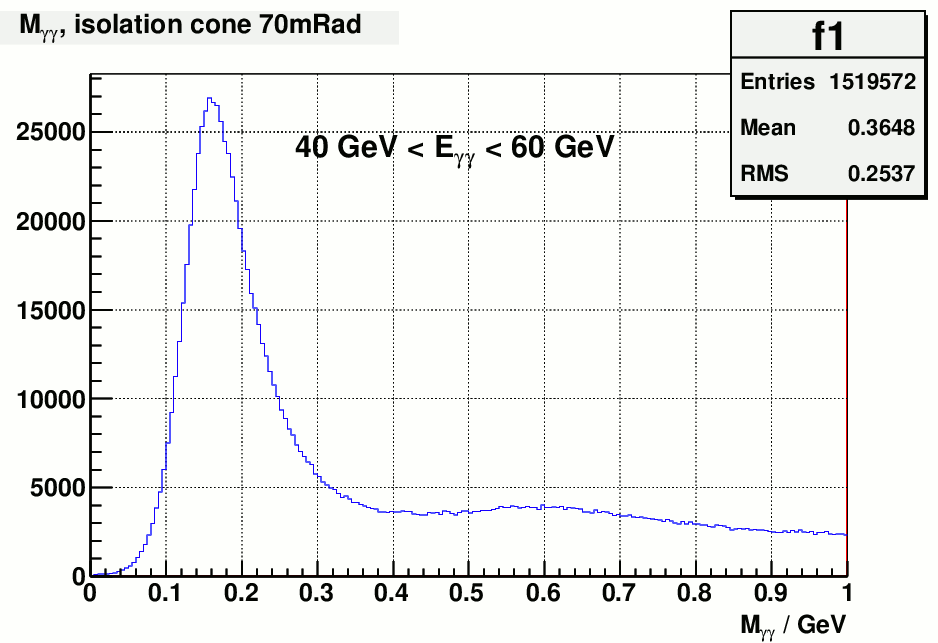
fig. 8 two photon masses from Fill_15419
It's interesting to see what the asymmetries of the inclusive pions look like. But subtracting out the background for this sample seems to be necessary.
The first thing I trid was random event mixing. Namely each photon from a specific event was paired up with all the photons from multiple other events. The
purpose is to remove the correlation between photons that come from the same pion/eta. However there is also a strong assumption made in order for this
approach to work, that is that photons come from different parents are completely uncorrelated. As we can see below, this assumption is compromised when
there is jet activity present.
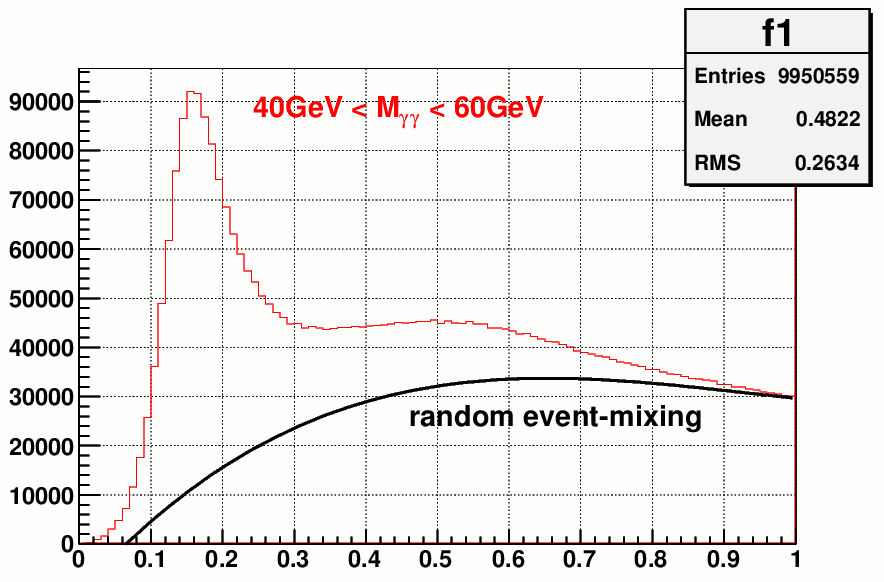
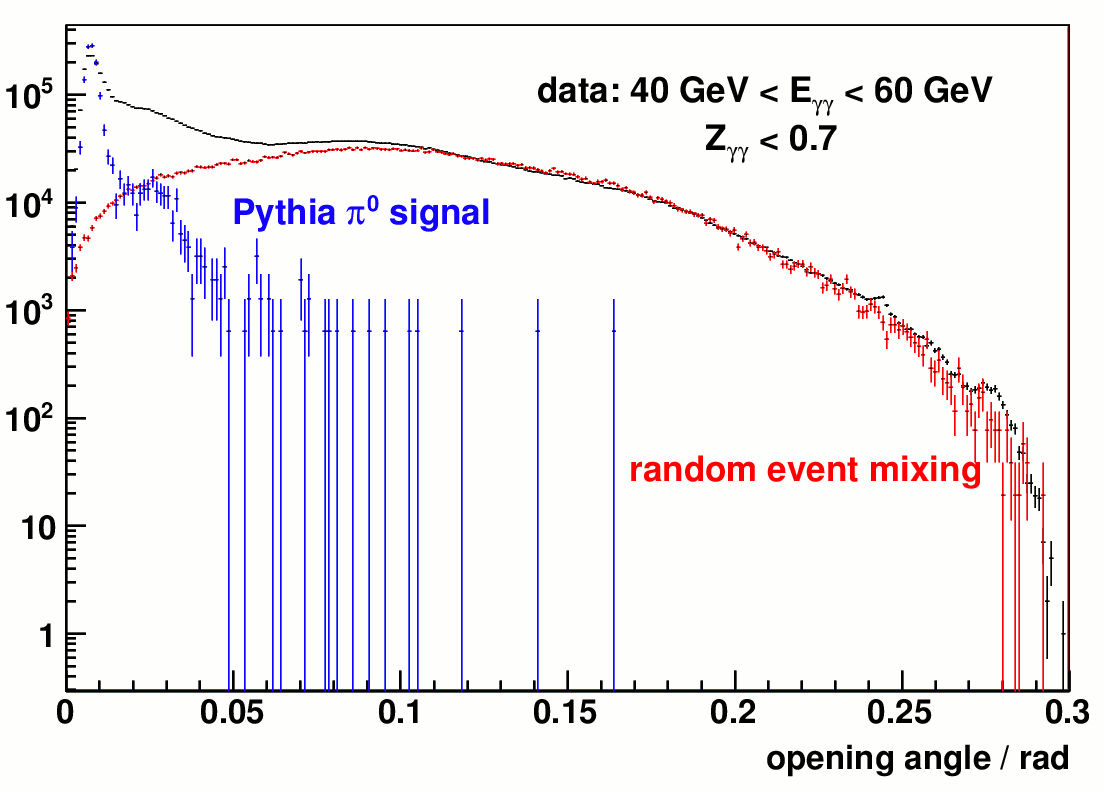
fig 9 a) inclusive diphoton mass with random mix event bkg fig. 9 b) opening angle distribution for data, pion signal from pythia and mix event
From fig. 9 b) it can be clearly seen that the 2-photon opening angle distribution has a hump at around 0.02 ~ 0.05 rad which can not be described by the
sum of pion signal and mix event distributions. These residual correlations could be induced by jets.
So I did the similar thing as the pion analysis in the mid-rapidity, I ran a jet finder for each event and align the jet axes before mixing two events. This approach
could introduce extra unnecessay correlation if there is no jet for some of events. In the mid-rapidity analysis people managed to get around this by combining the
shapes from random event mixing and jet-aligned event mixing, with a pT dependent weighting factor. But for this analysis I haven't been able to find a decent background
shape no matter how I combine the above two type of mixed events
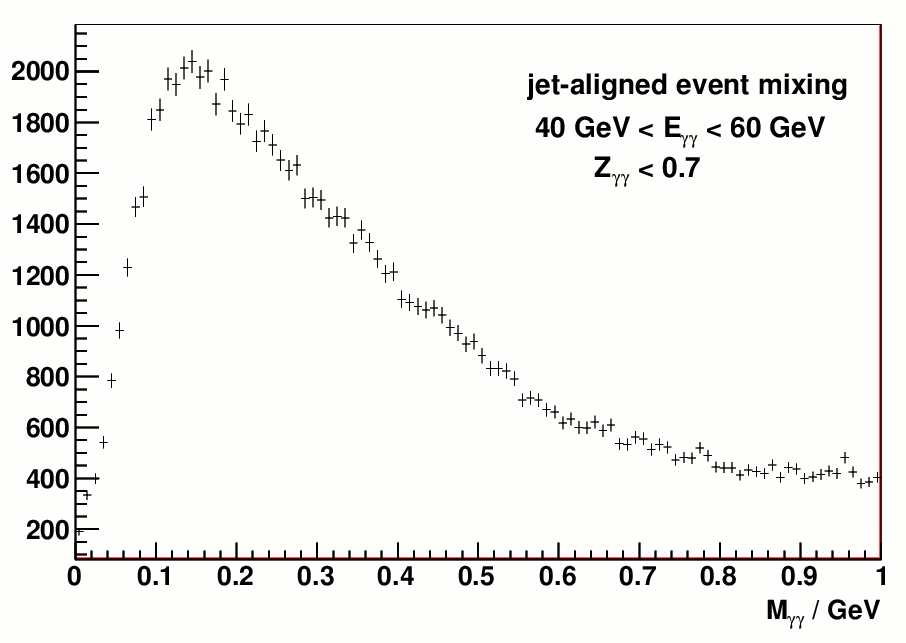
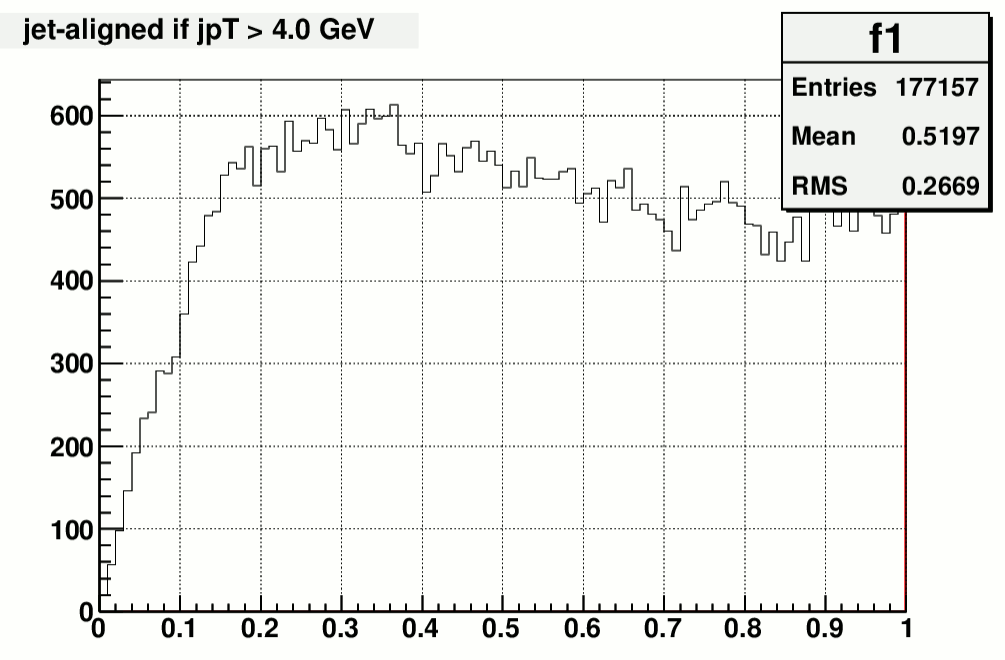
fig.10 a). diphoton mass frim jet-aligned event mixing, no cut on jet kinematics fig.10 b) same as a), but only align the jet axes if jet pT > 4.0 GeV
.gif)
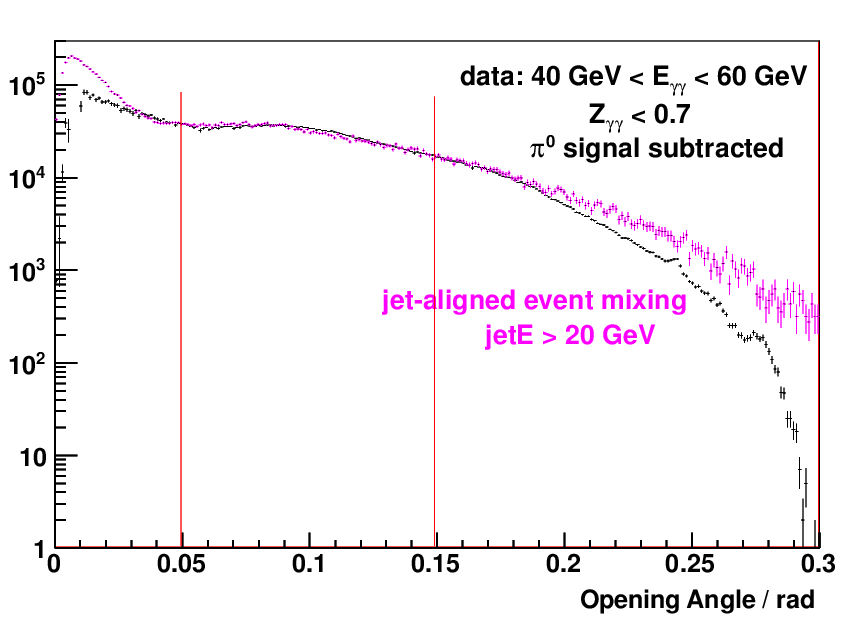
fig. 11 a) fig. 11 b)
From fig.11 a) one can see that there is excessive correlation induced by blindly aligning the jet axes, even for those events that was not
likey to contain a jet.
So I need to figure out a way to suppress these unneceaasay correlations.
- yuxip's blog
- Login or register to post comments
