- yuxip's home page
- Posts
- 2015
- 2014
- December (2)
- November (1)
- October (2)
- September (6)
- August (2)
- July (1)
- June (3)
- May (4)
- April (1)
- March (2)
- 2013
- December (1)
- November (1)
- October (3)
- September (3)
- August (2)
- July (1)
- June (2)
- May (1)
- April (3)
- March (1)
- February (1)
- January (1)
- 2012
- 2011
- My blog
- Post new blog entry
- All blogs
Analysis update, single photon simulation in GSTAR
Understading single photon reconstruction is important since it sets the baseline for pion analysis. The main purpose of single photon simulation is to evaluate to what extent our knowledge
of the shower shapes will affect the energy and position resolution, espeicially when an non-zero incident angle is involved. Futhermore, an accurate shower function will also be important if we
are going to pursue a pi/gamma separation algorithm that (partly) relies the goodness of shower fit.
As the first step, I generated a sample with 40GeV single photons uniformly distributed over the FMS coverage. Figure.1 shows the comparison between the true and reconstructed photon position on large cells.
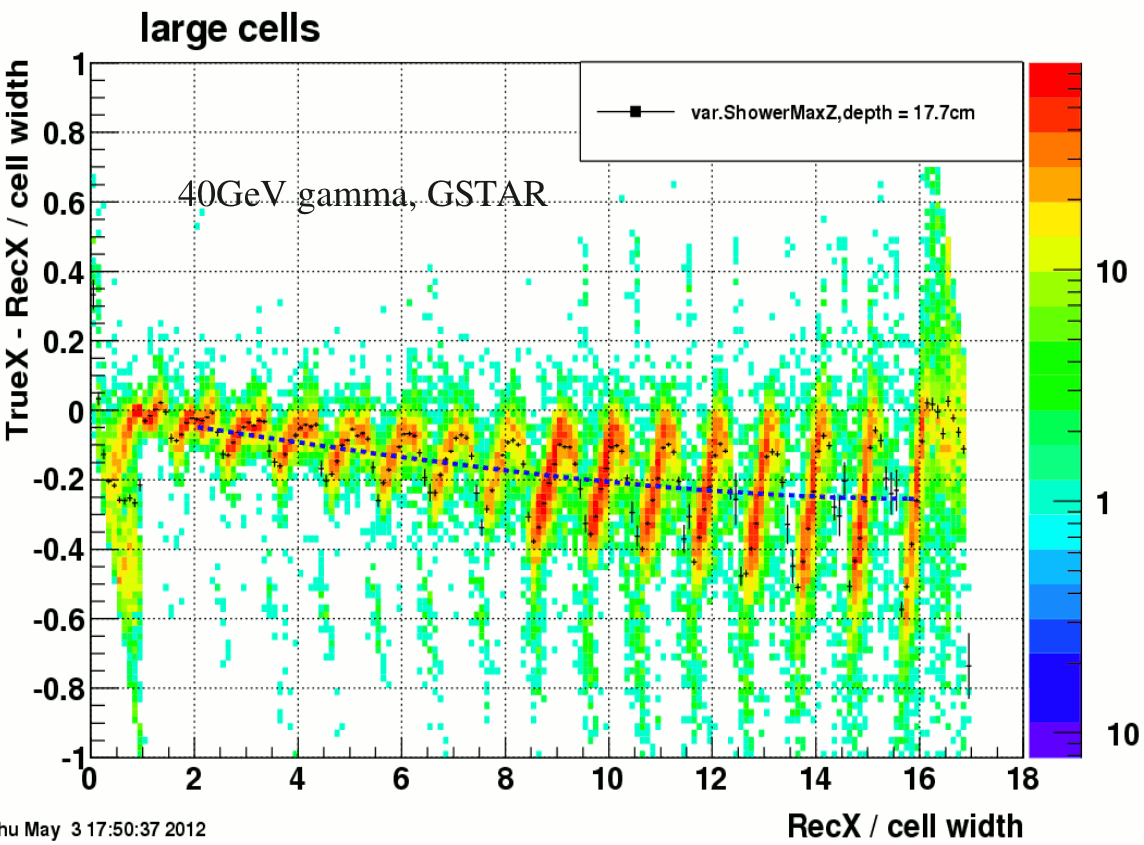
fig.1 trueX vs reconstructed X
As I will explain below, the overall shift of the mean dx is due to a simple geometric issue and the discrete band structures are caused by the difference between shower function and the actual shower shape.
In simulation, the (x,y) coordinates of a photon are calculated on a fixed plane (which I call the "measurement plane"). This plane may or may not be at the same depth as the actual shower max of the photon where the reconstructed (x,y) are measured. And the difference between recontructed variables and "true" location w.r.t. the measurement plance will depend on incident angle.
.gif)
fig.2
As shown in figure.2, for the case of 40GeV photon the shower max is behind the nominal measurement plane. "True X" is defind as the horizontal coordinate on the measurement plane (blue dot). whereas the reconstruction will naturally find the red dot at the shower max plane. The difference can be describe as ∆x = Z(mea.)*tanθ – Z(ShowerMax, θ = 0)*sinθ. And a fit using this formula to the mean of dx in figure.1 yielded the depth of the shower max = 35.1cm for the large cells (from the front face of the lead glass).
In real data the similar effect persists because the reconstructed (x,y) of the photons will be considered to be relative to the nominal measurement plane instead of their shower max. Therefore depending on the energy difference (Zrr) and relative orientation of the photon pairs, Drr (2-photon separation) will be different even for a fixed opening angle.
Similar structure was also observed for small cells, but less significantly.
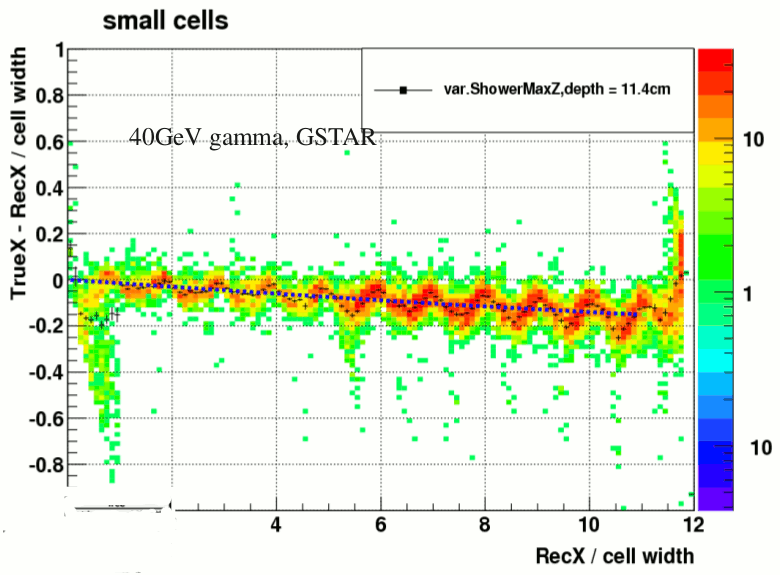
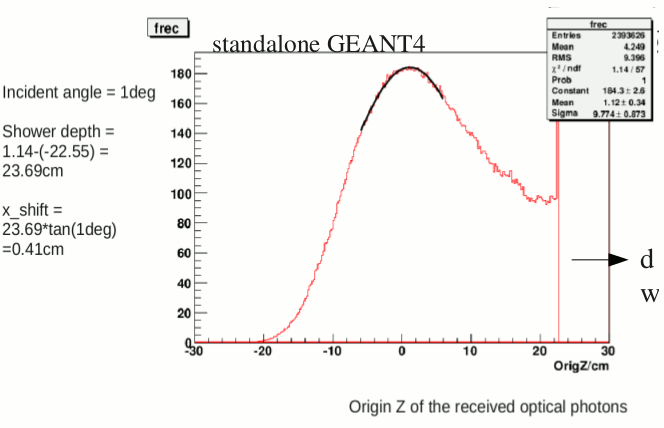
figure.3 a). recX vs trueX, small cess figure3. b) GEANT4 simulation to find shower max
Fit of the mean dx gives the depth of shower max = 24.4cm, which is pretty close to that obtain from the standalone GEANT4 simulation (23.7cm.
Then I moved on to compare the cluster shapes in simulation and the shower function. First for the large cells:
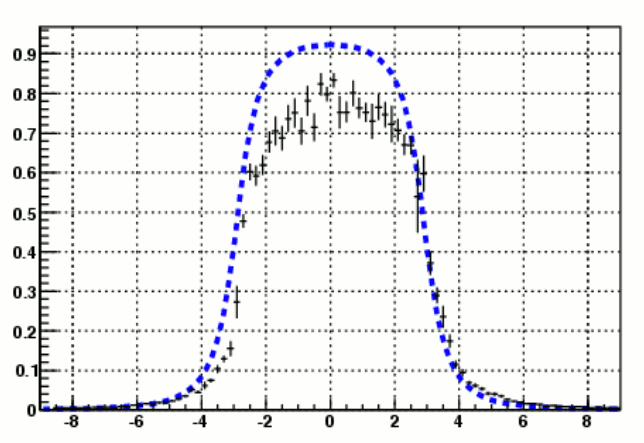
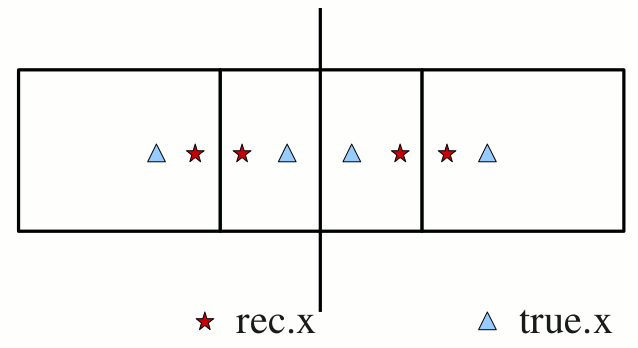
figure.4 a). cluster shape on large cells figure4.b) relative positions of rec.X and true X, due to inconsistent shower shapes
Here it's worth pointing out that cluster shape ( f = Ehit / Ecluster )is not exactly the same as the shower shape ( f = Ehit / Ephoton ) just because they are normalized differently. Due to tower efficiencies and cut-offs in the clustering, a cluster only represents a subset of all the energy deposition of the incident photon. Since calibration is done in terms of photon energy, generally Ecluster < Ephoton. So the amplitude of cluster shape is expected to be higher than that of the shower function, even when their shapes agree very well. In this case, when the cluster energy is passed on to the shower fit, the resultant photon energy will have taken into account of the "missing" energies that were dumped in inefficient/dead towers or towers that are outside of the cluster. Also in the repsence of the background, the energy fraction on the tails of the cluster will usually be higher than the center, when shower function matches well with the actual shower shape the fiiting procedure will provide some level of background suppression. The reason for this is simply due to the fact that excessive tail energy reduces the energy fraction of the center, which in turn will pull down the amplitude (photon energy ) of the fiited shower function.
But in the above case of the large cells, the amplitude of the cluster shape is already smaller than the shower function without any background present at the tails. This discrepancy will lead to a Ecluster vs Ephoton relation (Ecluster > Ephoton) opposite to the general case (Ecluster < Ephoton), as shown below:
.gif)
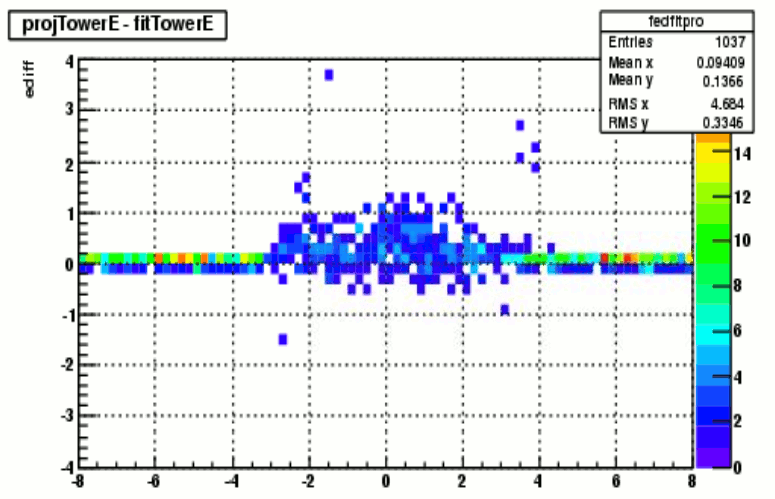
figure.5 a). Ecluster vs Ephoton figure.5 b). difference between tower energies before and after the fit, vs tower location
Figure 5 b). explains how the shower function adjusts itself to fit the cluster shape. The center portion of the shower function has to be scaled down in order to fit, resulting a less photon energy.
There is a different story for the shower fit on small cells:
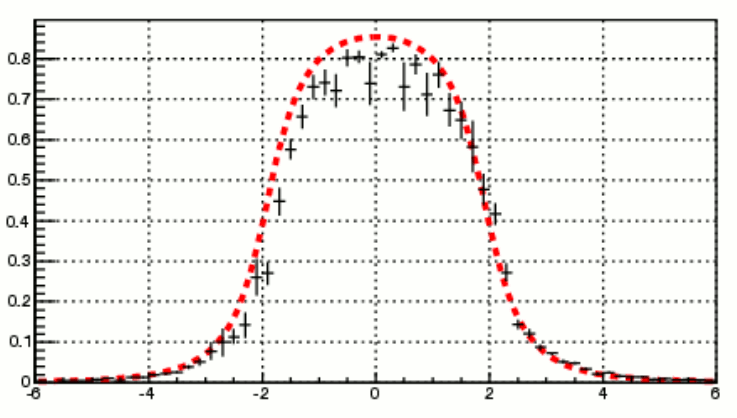
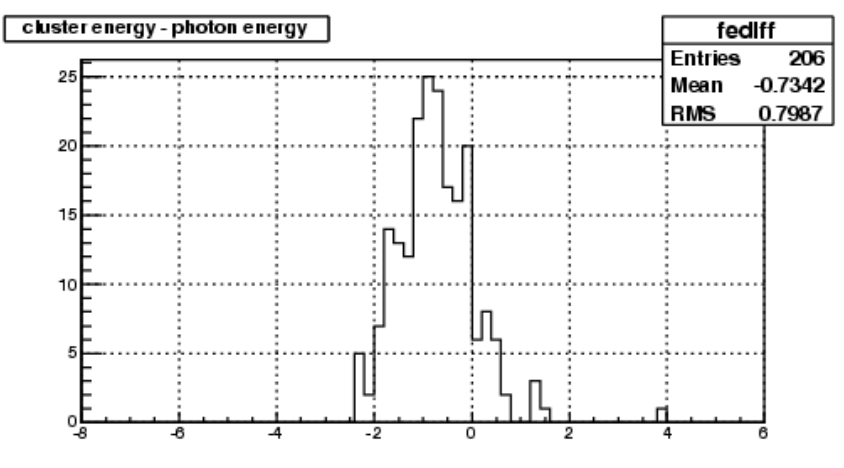
figure.6 a). cluster shape on small cells figure. 6 b). Ecluster vs Ephoton
The agreement between the shower function and cluster shape is better compared to the large cells, However the center portion of the cluster shape is still lower than shower function which is opposite to what we would expect if the two shapes perfectly match. Part of the reason might be that the cluster shape was actually measure with a allowance in the y-direction which was +/- 0.5 cell width. so it not exactly evaluated at y = 0.
The other difference compared to the large cells is that the photon energy is higher than cluster energy, which agrees with my expectation due to reasons I pointed out above.This means for small cells, the amplitude of the shower functions moved up in order to fit the tails of the cluster shape, which lead to a greater difference in the tower energies at the center portion before and after the fit as shown below:
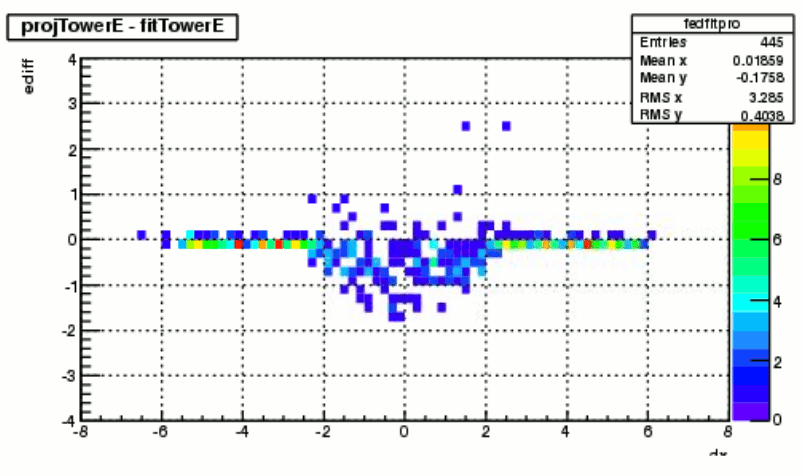
figure 7. difference between tower energies before and after and fit, as a function of tower location
The different behaviors of the shower fit for large and small cells (fits the center portion or the tails) are due to the way the error function of the fit was defined. chi2 = (dE) / errf. Error function errf is shown below for the case of 40GeV photons.
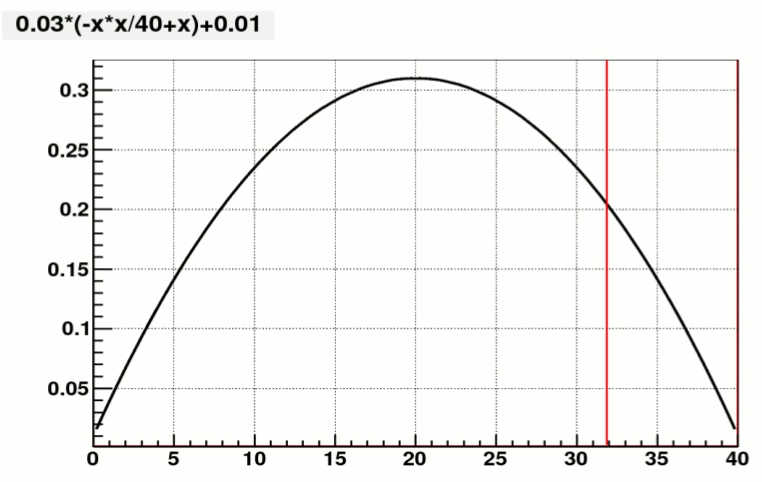
figure 8. error function vs tower energy, for 40GeV photons
So both of the tails and center portion are emphaized. Depending on the size of dE (tower energy differences) at these locations, the shower function would be pulled by either of them.
- yuxip's blog
- Login or register to post comments
