- yuxip's home page
- Posts
- 2015
- 2014
- December (2)
- November (1)
- October (2)
- September (6)
- August (2)
- July (1)
- June (3)
- May (4)
- April (1)
- March (2)
- 2013
- December (1)
- November (1)
- October (3)
- September (3)
- August (2)
- July (1)
- June (2)
- May (1)
- April (3)
- March (1)
- February (1)
- January (1)
- 2012
- 2011
- My blog
- Post new blog entry
- All blogs
FMS Meeting04/29/2013 --FMS-midrapidity correlations
In the previous post I showed some FMS pion vs BEMC-only jet correlations, with a selection that enhances the away side activity. At the end I tried to come up with
some criteria to split the data sample into different classes. The plan was to make a cut on the pT of the away-side jet which falls within 0.2pi around the opposite
direction of the pion momentum in phi plane. The pT cut was chosen to be 2.0 GeV.
Here I am showing the azimuthal correlation for the event classes selected by the above cut for day095 st_fms data in figure 1.
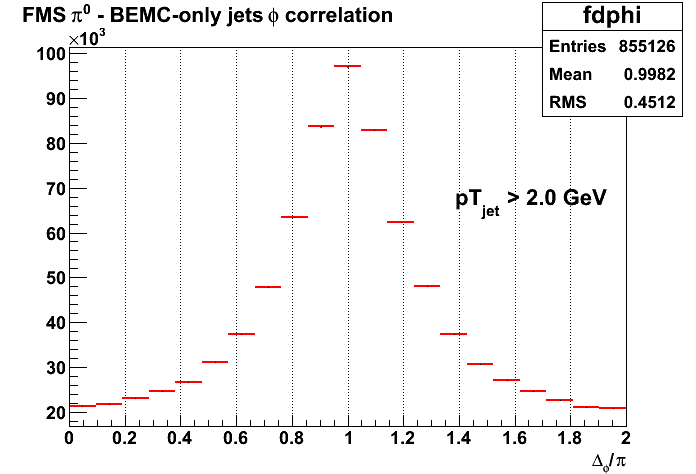
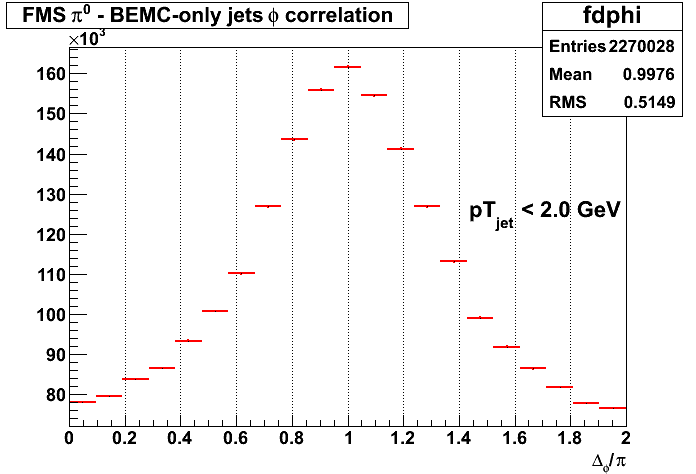
Figure 1 a). dphi distrubution with BEMC jet pT > 2.0 GeV Figure 1 b). dphi distribution with BEMC jet pT < 2.0 GeV
The pT cut on foward pion is 2.5 GeV. As shown in figure 1 the requirement of jet pT to be less than 2 GeV does not completely remove the away-side peak, but
it does suppress the strength of the correlation compare to the other type of events.
As a comparison figure 2 shows the azimuthal correlation between FMS pion and mid-rapdity full jet, where the two event classes can be more clearly separated.
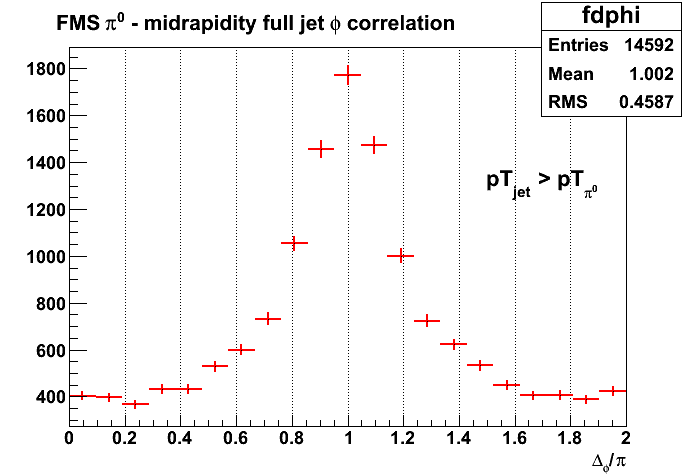
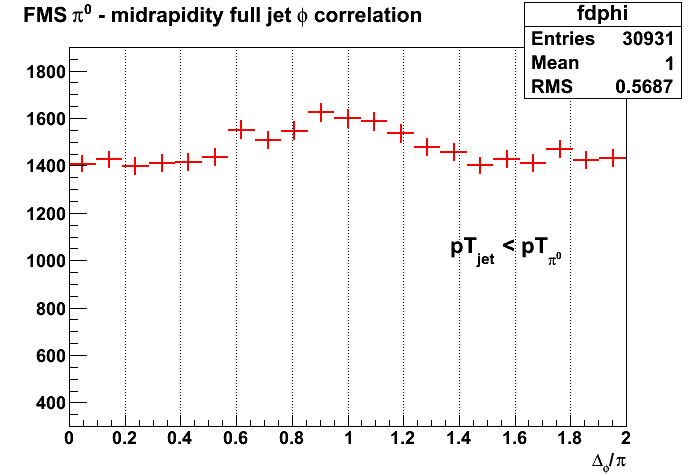
Figure 2 a). dphi distrubution with full jet pT > pion pT Figure 2 b) dphi distrubution with BEMC jet pT < pion pT
This sample is from FMSJP0*BEMCJP0 trigger which has the TPC read out, but the statistics is very limited. Before diving into the analysis of large statistics
fast triggers, I looked at the asymmetries for this coincidence trigger separated into the classes shown above. For each event I compared the pT of the leading
jet in the away side region ( abs(dphi - pi) < 0.2*pi ) with pT of the pion. Notice that although I have a pT_jet > 1.0 GeV cut for all the correlation plots, there is no
cut on the minimim jet pT in the pion asy. analysis. In another words, if there is no jet on the away side the event will also be classified as figure 2 b).
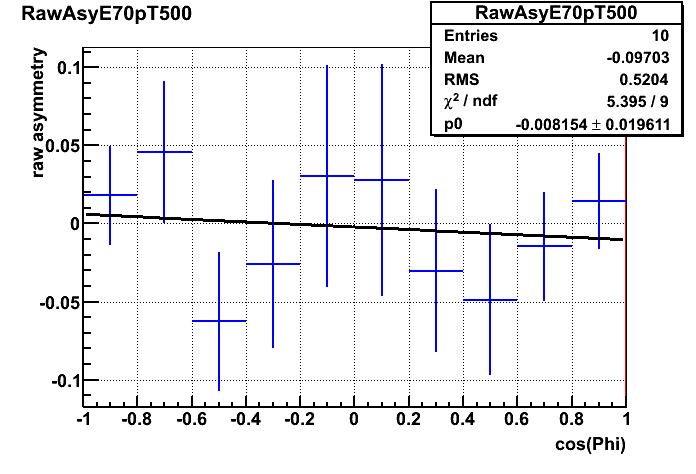
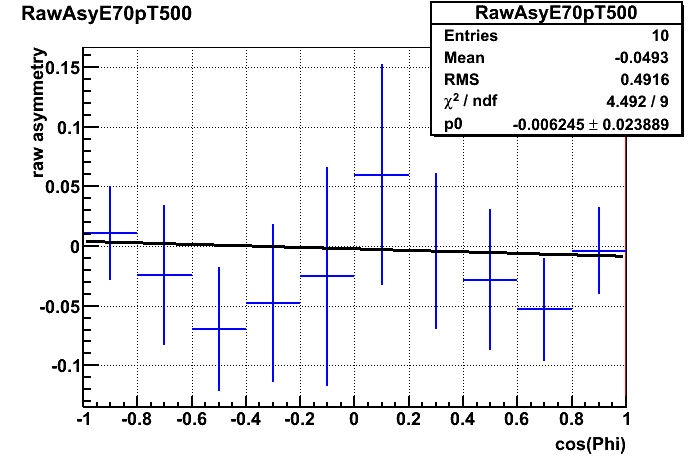
Figure 3 a). pion raw asy. --recoil jet pT > pion pT Figure 3 b). pion raw asy. --recoil jet pT < pion pT
For figure 3, the energy of pion is [ 50 GeV, 90 GeV ], pT of the pion is [ 2.5 GeV, 7.5 GeV ]. The cos_phi dependence is fitted with 1-parameter function which has the
mean lumi. ratio incorporated as a constant. The asy. for both classes are zero within errors due to limited statistics of the coincidence trigger
Figure 4 shows the number of jets in the recoil region and pT of those jets for the coincidence triggers.
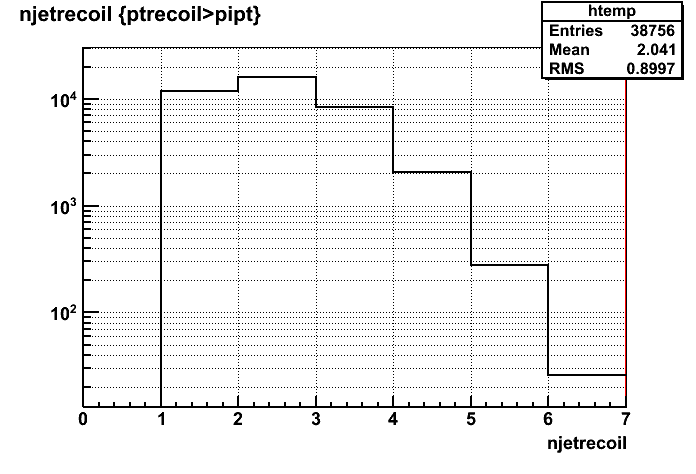
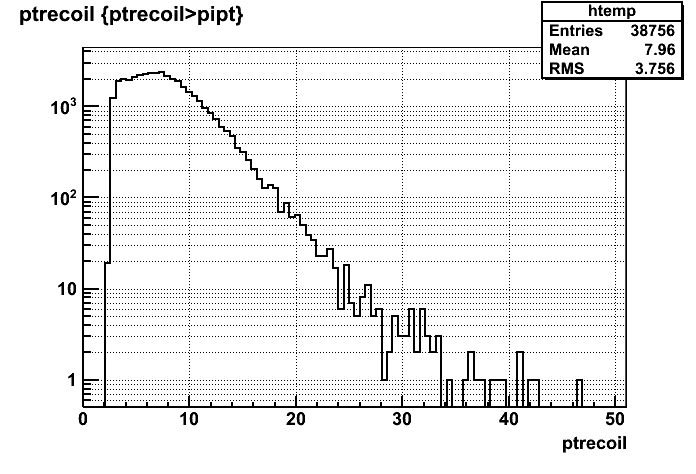
Figure 4 a). # jets in the recoil region for events with recoil jet pT > pion pT Figure 4 b) pT of jets in the recoil region for events with recoil jet pT > pion pT
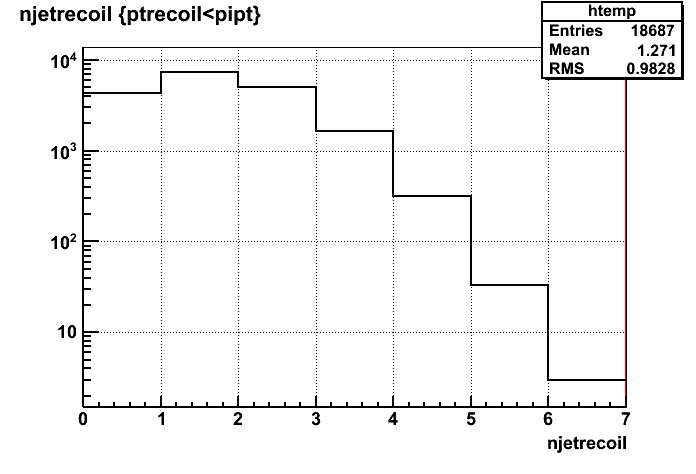
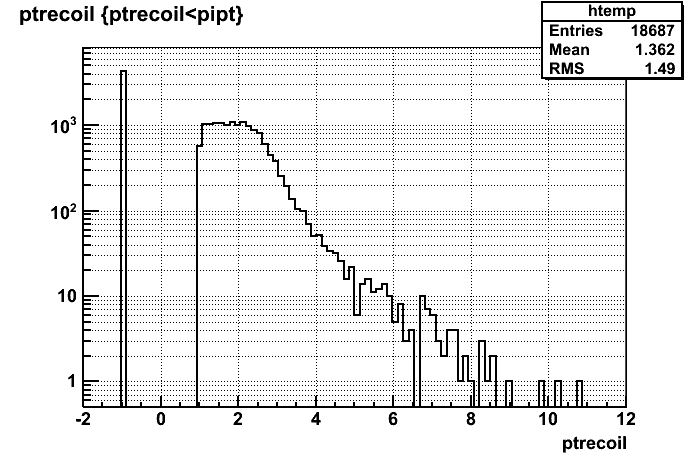
Figure 4 c). # jets in the recoil region for events with recoil jet pT < pion pT Figure 4 c). jet pT in the recoil region for events with recoil jet pT < pion pT
Figure 5 shows the asymmetries for events categoriezed by a slightly different way. This time I calculated the asymmetry for events where there is no jet (above 1 GeV ) on the away side, and compare it with events with a jet (above 1 GeV) in the away-side region.
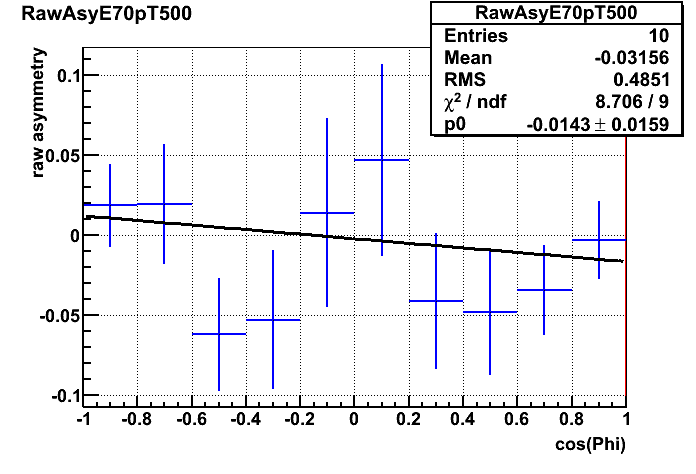
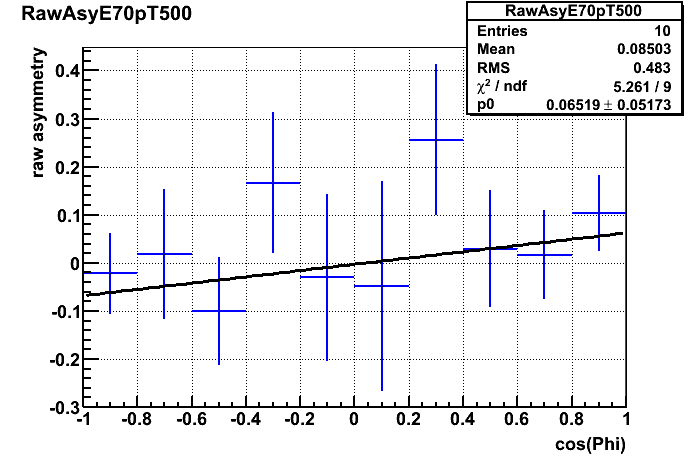
Figure 5 a) pion asy. for events with at least a jet (pT>1GeV) in the recoil region Figure 5 b) pion asy. for events without any jet (pT>1GeV) in the recoil region
Up till now it seem the data from st_physics stream is not enough to help on the asymmetry measurement although it allows for full jet reconstructions in the midrapidity.
Next I'll proceed with calculating asymmetry for events in st_fms stream, possibly using Figure 1-type of event categories.
Groups:
- yuxip's blog
- Login or register to post comments