- yuxip's home page
- Posts
- 2015
- 2014
- December (2)
- November (1)
- October (2)
- September (6)
- August (2)
- July (1)
- June (3)
- May (4)
- April (1)
- March (2)
- 2013
- December (1)
- November (1)
- October (3)
- September (3)
- August (2)
- July (1)
- June (2)
- May (1)
- April (3)
- March (1)
- February (1)
- January (1)
- 2012
- 2011
- My blog
- Post new blog entry
- All blogs
eSTAR meeting 08/12/2013 --fcs hadron energy resolutions
There has been continuing discussions on the energy resolution of hadrons with FCS, and potential differences between single particle simulations
and full pythia simulation. Here I'll give another update on charged pion energy resolution and its dependence on event topology ( inside jet or not )
as well as some fine tunings of the reconstruction algorithm.
Figure 1 is from Len's update a few weeks ago which shows the energy resolution for single particle and full simulations.
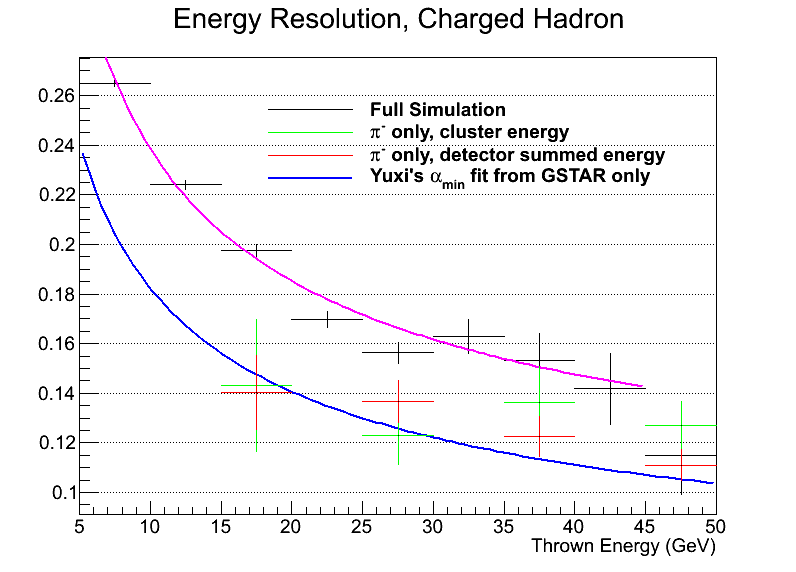
Figure 1. energy resolutions, single particle vs full simulation from Len
Previously there was an argument that at low energy results (with cluster energy) from single particle and full simulations should converge
since the number of particles from the same jet will become less therefore there's less confusion in adding ECAL energy to HCAL cluster
and in the matching.
I've looked into this energy and event topology dependence a bit closer. Now for each event in the full simulation I've
run the cluster finder and jet finder separately. Each HCAL cluster is combined with the corresponding ECAL clusters in
the front with the criterion R < 4*EM cell width (same as Len). The inter-calibrations between HCAL and ECAL energies
is the same as my previous single particle simulations (alpha_min). For each HCAL cluster, if it's matched to a generated pi-
track, I went further to see if this pi- track is inside a particle jet or not (particle jets were reconstructed with anti_kT, R = 0.7, pTmin = 1.0 GeV)
and the mutiplicity of the particle jet. Figure 2. is an example that shows the environment in which a pi- track lives.
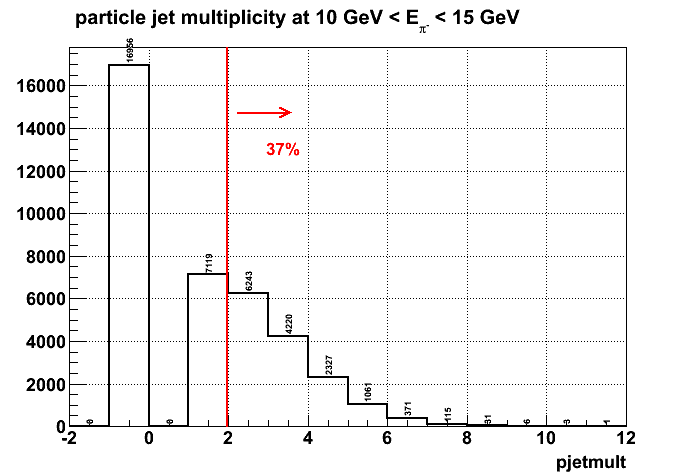
Figure 2. parcticle jet track mutiplicity for pi- from 10 to 15 GeV
The bin at -1 means the pi- track is not in any jet. This plot shows that 37% of pi- live in a jet that has some other tracks besides the pi-
itself. From here on I define an isolated pi- if the corresponding particle jet multiplicity is -1 or 1.
Figure 3 a) and b) show the fraction of isolated pi- vs pi- energy and pT.
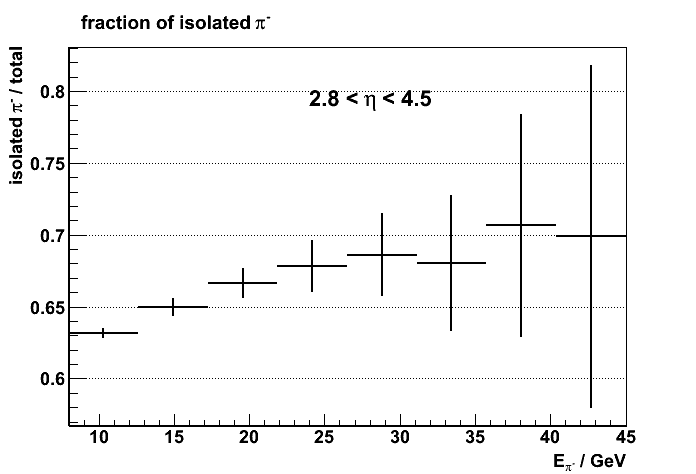
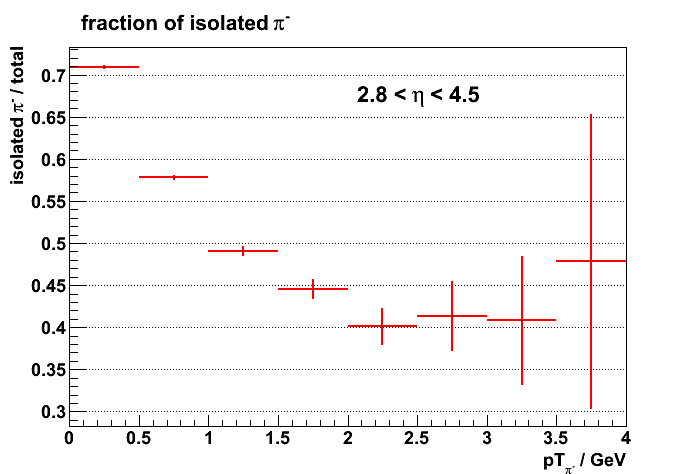
Figure 3 a). # isolated pi- / total vs pi- energy Figure 3 b). # of isolated pi- / total vs pi- pT
From figure 3 one can see the same trend as the previous jet studies, namely the multiplicity of jet depends on pT instead of energy. So we do not expect to see a low
energy hadron lives in a less busy environment. But low pT hadrons are more likely to be produced by low pT jets at large eta which in turn has less particle multiplicities.
Figure 4 shows the energy resolutions for isolated pi- and pi- that comes from jets with track multiplicities greater than 1. As well as results from single pi- simulations
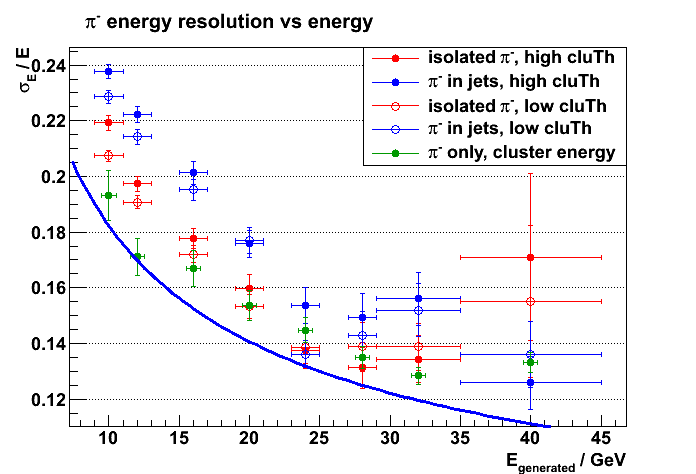
Figure 4. pi- energy resolutions
There is another set of points (hollow points) which are caculated by lowering the threshold of cluster energy. Previously any cluster with energy
less than 0.5 GeV will be discarded. But the average mip energy deposit in the ECAL is ~ 0.3 GeV. In order to include mip like energy deposits
when combining ECAL and HCAL clusters I've reduced this threshold down to 0.1 GeV. After this procedure the energy resolution becomes better
for low energy hadrons but the effect is almost zero at higher enegies. The results from single pi- simulation is roughly on the same level as isolated
pi- in full simulation (with reduced cluster energy threshold). The remaining discrepancy between single pi- cluster energy and detector summed energy(blue line)
must come from the fluctuations in the energies outside the cluster. The current threshold of tower energy in the clustering is 10MeV.
Update:
The remaining discrepancy between the resolution in single pi- simulation with clustering and isolated pi- in full sim. is perhaps due to the difference in
pseudorapidity distributions. Generally the energy resolution becomes better and low eta because there is less channeling effect in the ECAL and the
sampling fraction in HCAL slightly increases.
Figure 5 shows the eta distribution of pi- track in single particle and full simulations.
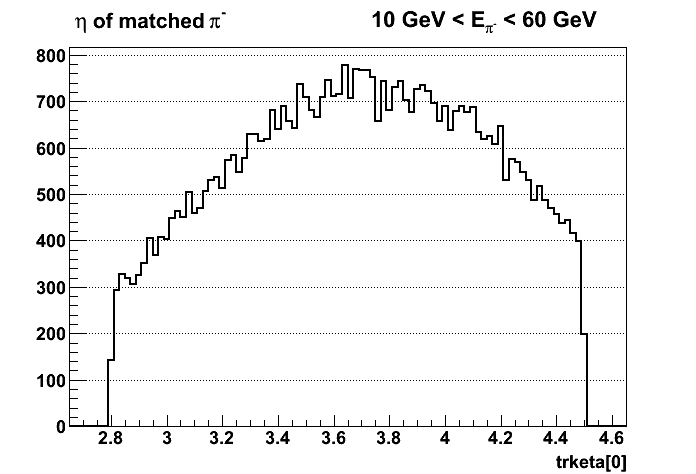
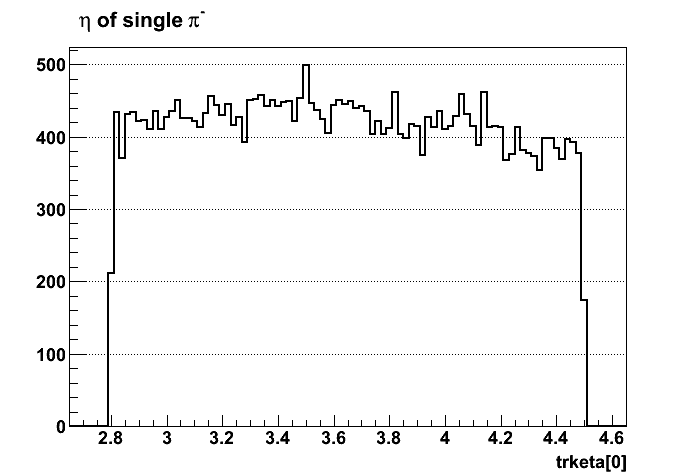
Figure 5. a) eta distribution of pi- track in full sim. b). eta distribution of pi- in single particle sim.
Figure 6 shows the similar comparison as Figure 4 but single particle results are divided into two eta bins: Low Eta ~ (2.8, 3.4), High Eta ~ (3.4, 4.5)
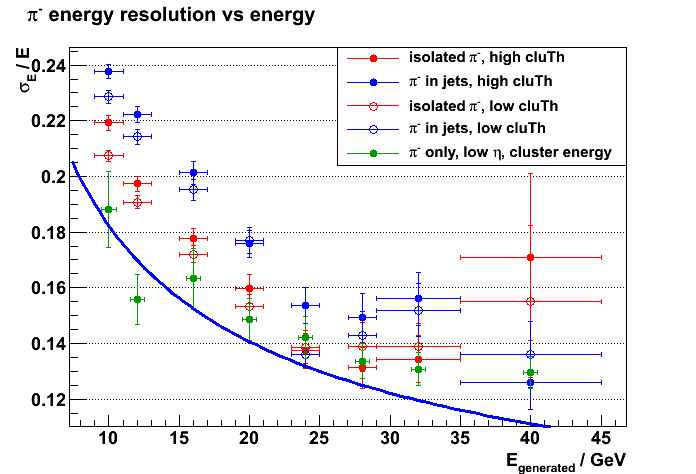
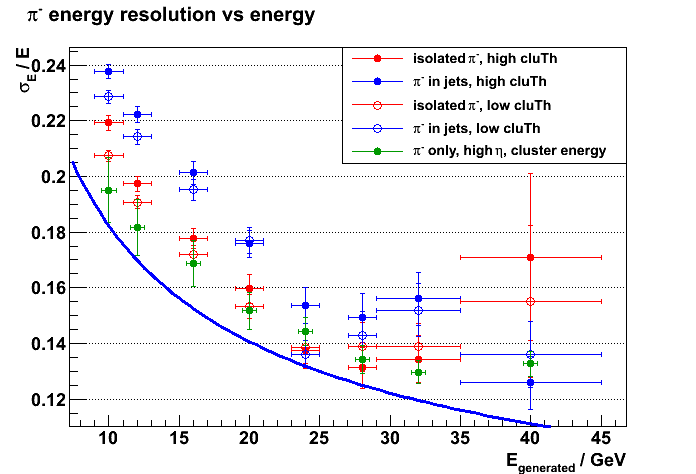
Figure 6 a). pi- energy resolutions, single pi- from eta 2.8 to 3.4 b). pi- energy resolution, single pi- from eta 3.4 to 4.5
- yuxip's blog
- Login or register to post comments
