FMS Meeting06/02/2013 -- A_N for different event topologies, pi0/eta background
Previously I showed the x_F dependence of pion A_N for events with different near- / away-side activities around the pi0. The same plots are posted below,
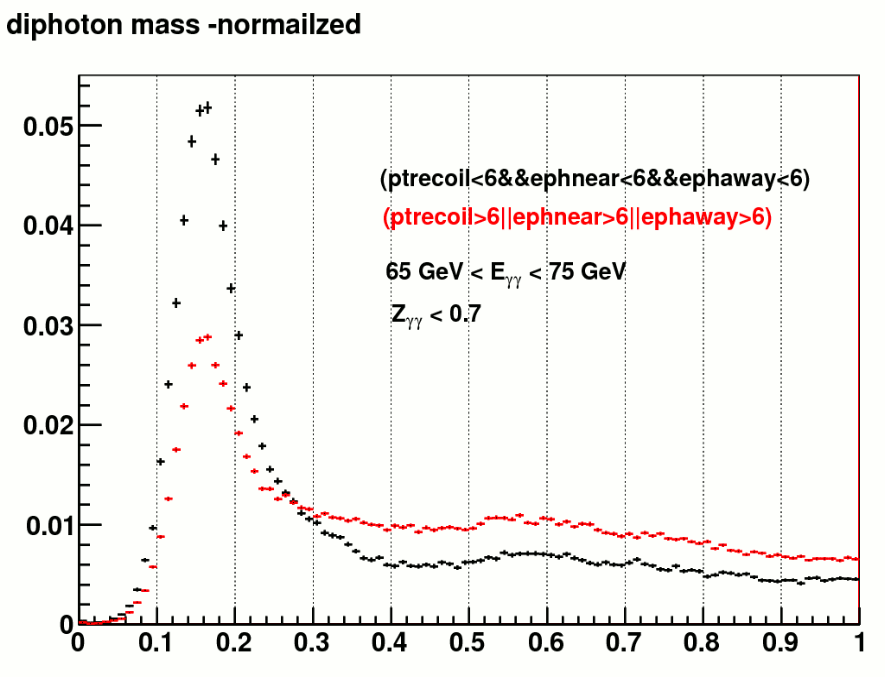
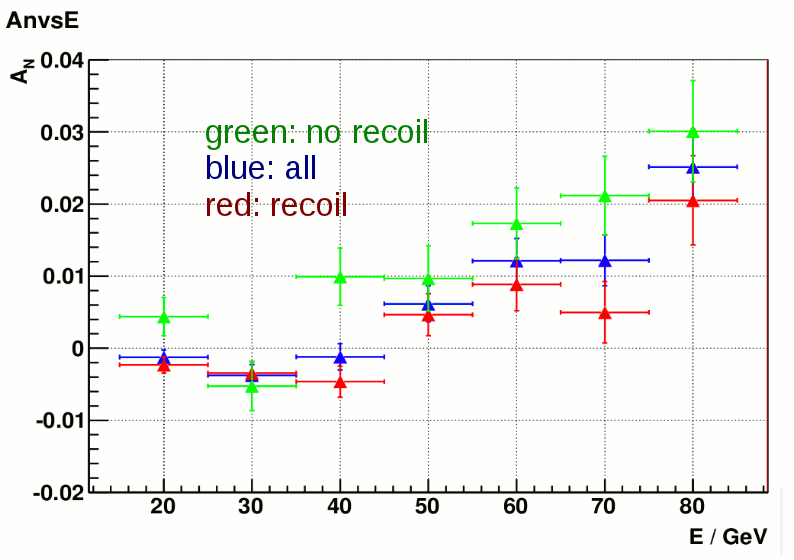
Figure 1 a). mass distribution of the two event classes Figure 1 b). A_N vs x_F for the two event classes
The definition of the two classes are as follows:
a). only one pion present. No additional photons ( > 6GeV) within 0.2*pi in azimuth around the pion (near side)
or exactly opposite (away side) to the pion on FMS. No BEMC jet-like clusters ( > 6GeV) on the away side.
---no recoil, red points on Figure 1 a). , green points on Figure 1 b).
b). with at least one additional photon on the near side or away side on FMS, or an away side jet-like cluster in BEMC
--- recoil, black points on Figure 1 a)., red points on FIgure 1 b).
The asymmetries on Figure 1 b) was calculated without subtracting the background. Since the background level of these 2 event class
are very different as shown in Figure 1 a). It's not clear if the asymmetries of the pion is different between them. This initiated the effort
to estimate the background shape through simulation.
Before going into the details in data/simulation comparison. I looked at the asymmetries in a simplified scenario. Notice that since the photon
pair which makes up the pion is localized in the small area on the detector, the background level under pion signal is pretty much determined
by the extra activities around that small area. So if I require that there is no additional photons around the pion for both of these two types of
events, and that they're only defined in terms of the difference on the away-side. I can get the mass shapes matched up while still maintains the
distinction in their topologies ---one type is more jetty while the other is more towards diffractive. And in this case the backgrounds are identically
low for both types.
The diphoton mass distribution following the new definition is show in figure 2).
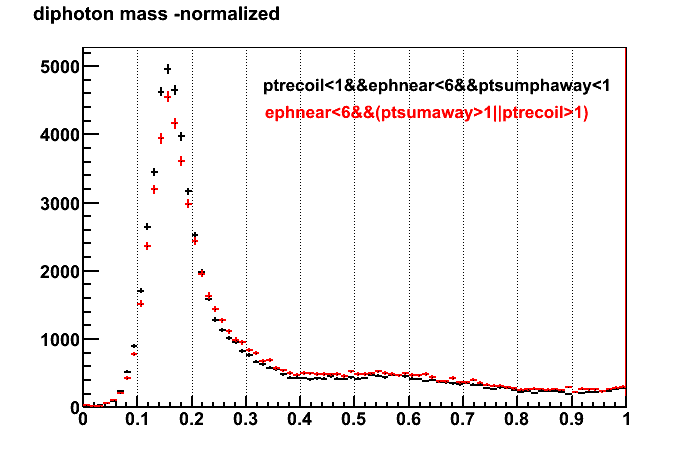
Figure 2). mass distribution with different deinitions of event topology
The variables on figure 2 are defined as follows,
ephnear: the highest energy of the photons around the pion on FMS near side
ptsumaway: sum pT of all the photons on FMS away side, This is different from figure 1 where i was using ephaway -- the highest energy of photons on FMS away side
ptrecoil: pT of the jet-like cluster on BEMC
In both of these 2 class I require there is no addtional photons above 6 GeV on the near side. The asymmetries of these two types of events are shown in Figure 3).
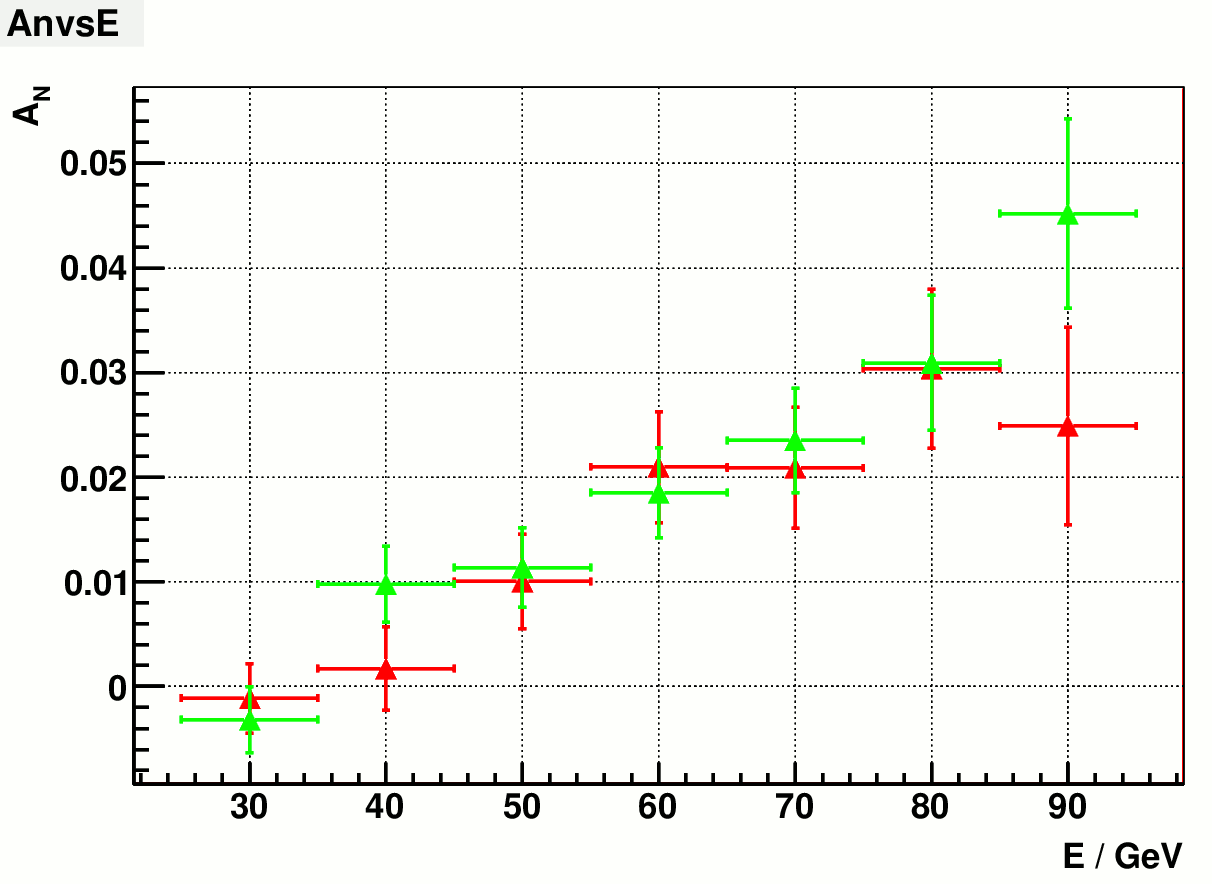
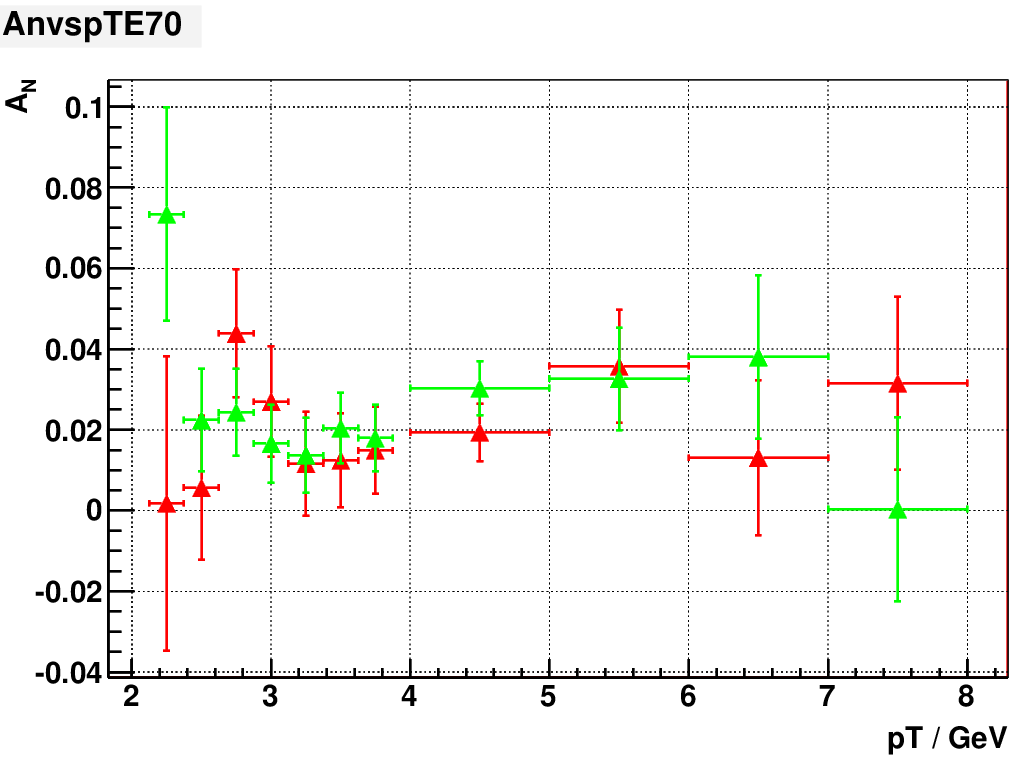
Figure 3 a). A_N vs energy of the newly defined event topoloies Figure 3 b). A_N vs pT @70GeV of the newly defined event topologies
Green points are events with away side activities (ptsumaway>1||ptrecoil>1) corresponding to black points on Figure 2).
Red points are events without any away side activity (ptsumaway<1&&ptrecoil<1) corresponding to the red points on Figure 2)
So there is no clear distinction in A_N between these 2 types of events, when they both have the same condition on the near side.
Next I will still be pursuing A_N with background subtraction for inclusive pions as well as pions having different event topologies.
simulation/data comparison
The key in getting data/simulation matched up is to obtain a consistent energy scale in data and simulation. Namely to set the energy scale
at working point (25GeV on large cell, 40GeV on small cells) and make energy dependent corrections at various other energies.
According to my understanding, energy dependent correction in data was estimated by looking at how the eta mass shifts as energy and forcing the
mass to be corrected back to nominal value (although the peak position could be affected by the background shape and the significance of eta
signal is limited, I am not aware of the details of this analysis). In principle this also means the bin migration is folded in the calibration. The correction
was applied to each reconstructed photon energy by evaluating the curve at half of the eta energy. Following the same way I estimated the correction
in simulation by looking at MC matched eta candidates in small and large cells separately.
Figure 4 shows eta mass vs energy from the previous simulation (~0.9M). Due to limited statistics only the mean was calculate (no fitting)
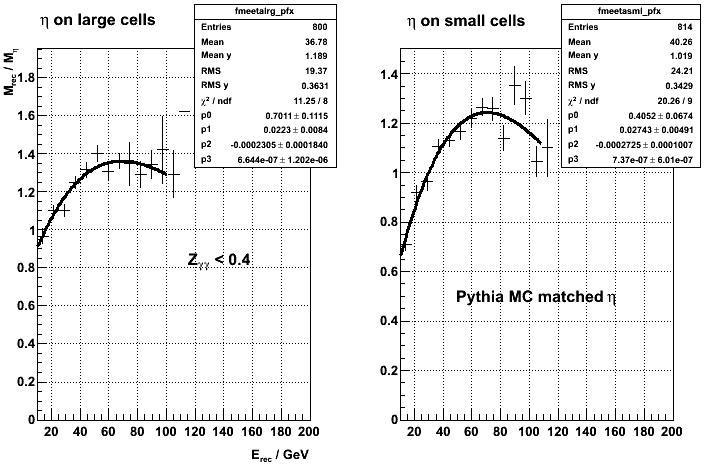
Figure 4). eta mass vs energy from a previous dataset
Figure 5 shows simulation/data comparison with this correction,


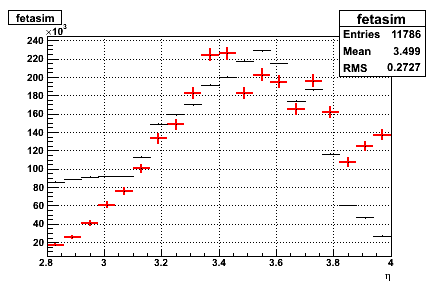
Figure 5). simulation vs data with energy dependent correction
However when looking at the mean value of eta candidates after this correction it seems the mass still depends on energy.
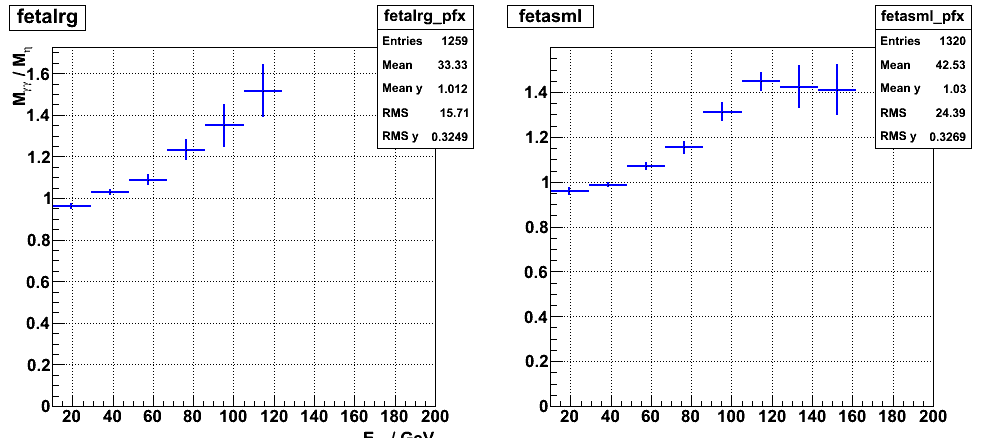
Figure 6). mean of eta mass vs energy after correction
Last week I produced another 1M events separated in 4 partonic pT bins (2-4GeV, 4-8GeV, 8-16GeV and 16-32GeV) in order to get more pi/eta at higher
energies. With this sample I fit the eta mass in different energy bins. As shown in Figure 7).
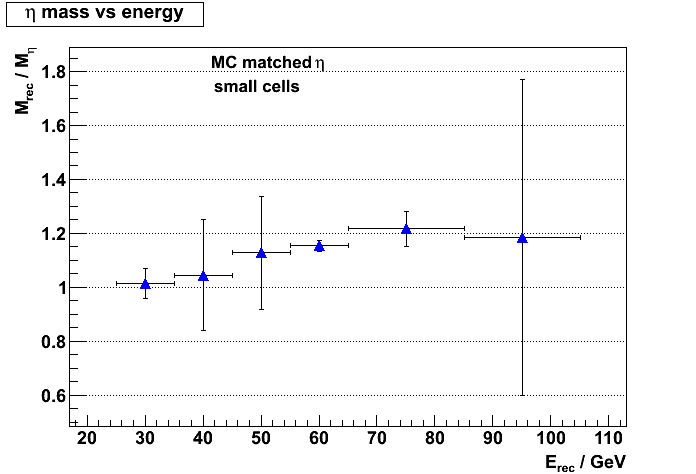
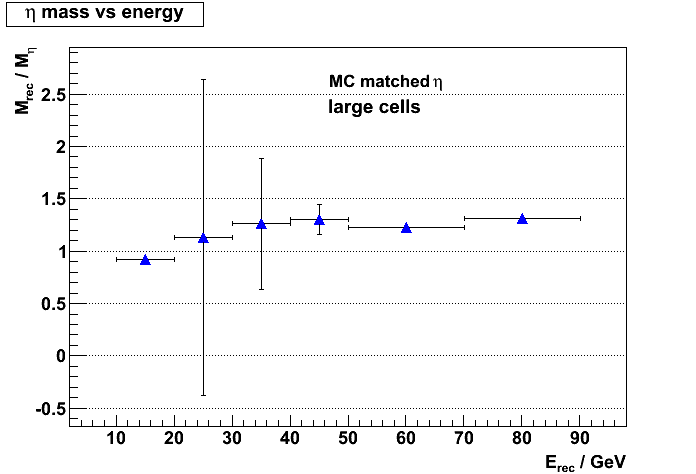
Figure 7 a). eta mass vs energy, small cells Figure 7 b). eta mass vs energy, large cells
The mass distribution after MC matching was fit to a skewed Gaussian and the peak position was taken as the reconstructed eta mass. The error was taken from the
parameter which represents the mean of the gaussian component. The actual fits can be found here and here.
Comparing Figure 4 and 7 one can see that the mass shifts are roughly identical between the mean and fitted peak position. It's still yet to be seen whether the variation
in figure 6 was real or not. If it is real, I need to check if this variation also happens in the data.
Given that eta signal is not so significant in either data or simulation, fitting eta mass and see how is varies with energy is not so precise in determing the energy dependent
corrections. There are more discrepancies poping up when I looked at the comparison in finer energy and pT bins. So in parallel with the above correction scheme I am
also trying to see if it's possible to exploit pions. By identifying a class of pion candidates which suffer less from the problem of reconstructing the non-energy variables (Dgg)
we can use the mass of pion as an indication of the energy corrections. This class of events are likely to be (a subset of ) 2-cluster events where the 2 photons come from different tower clusters. The clear topology of these type of events may have less problem in reconstructing the 2-photon separations. But at the same time these events
becomes less and less at higher energies. Figure 8 shows a comparison between 1-cluster events and 2-cluster events in term of rec. Dgg vs generated Dgg.
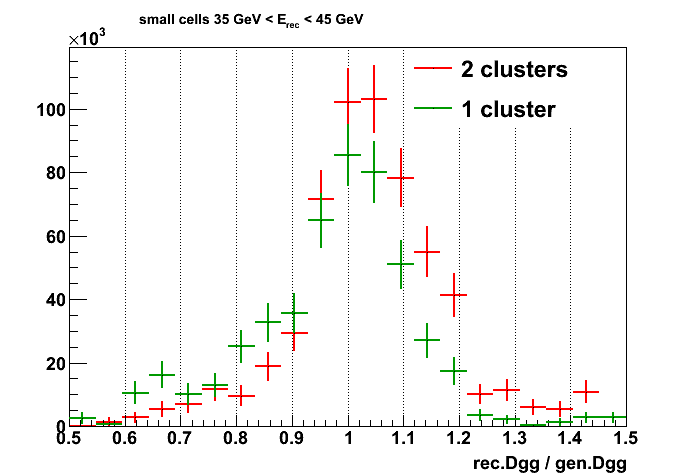
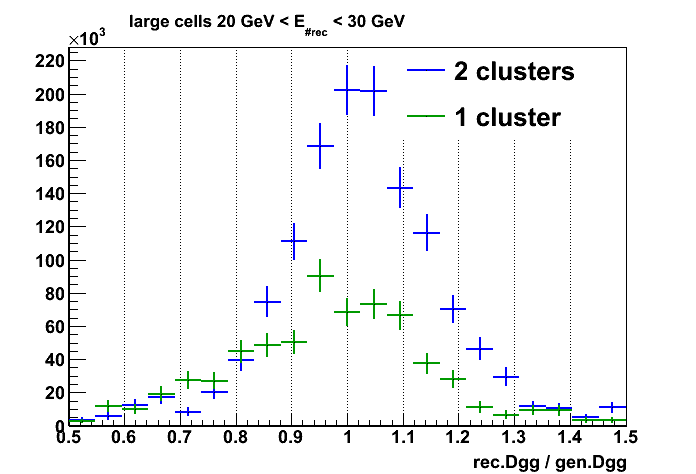
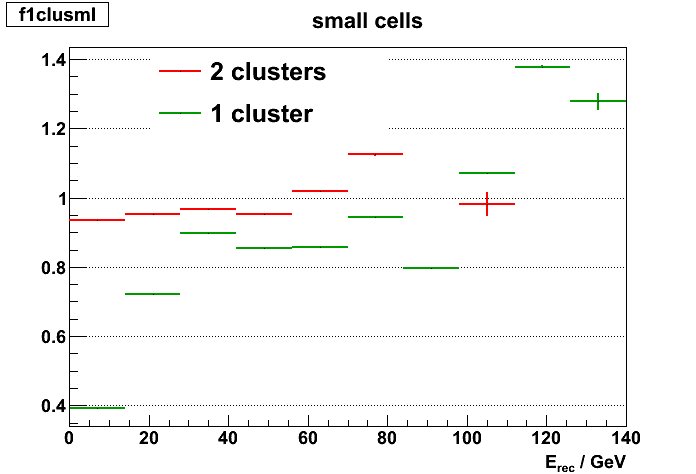
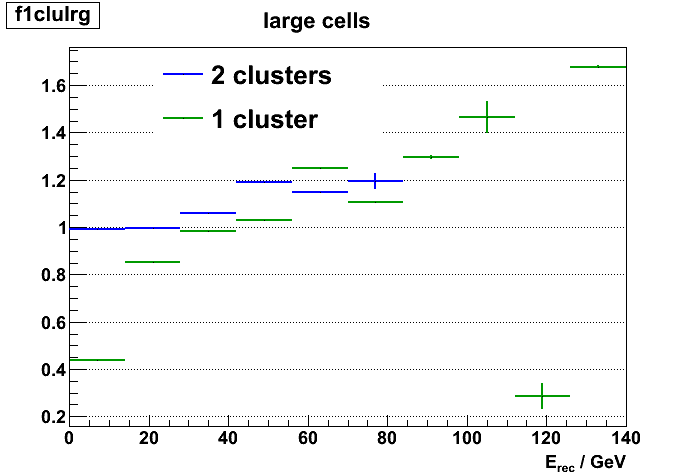
Figure 8) Dgg in 1-cluster and 2-cluster photon pairs
FIgure 8 was produced from the new 1M events sample and it shows generally 2-cluster events have better behavior in separation measurement than 1-cluster
events but they quickly die out at higher energy. It needs more investigation to see if it's possible to calculate energy dependent correction base on 2-clusters events
or even a subset of 2-cluster events.
- yuxip's blog
- Login or register to post comments
