- yuxip's home page
- Posts
- 2015
- 2014
- December (2)
- November (1)
- October (2)
- September (6)
- August (2)
- July (1)
- June (3)
- May (4)
- April (1)
- March (2)
- 2013
- December (1)
- November (1)
- October (3)
- September (3)
- August (2)
- July (1)
- June (2)
- May (1)
- April (3)
- March (1)
- February (1)
- January (1)
- 2012
- 2011
- My blog
- Post new blog entry
- All blogs
FMS Meeting 07/14/2014 --FMS inlcusive pi0 A_N vs E and pT
Last time I proposed to calculate signal/bkg. fraction run-by-run. Since now the raw asymmtries is caluclated fill-by-fill, here I compare the signal/bkg. fractions from the run-by-run average vs fill-by-fill.
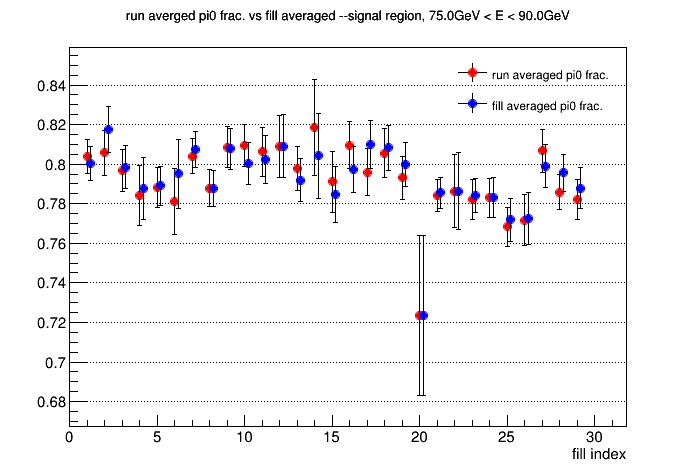
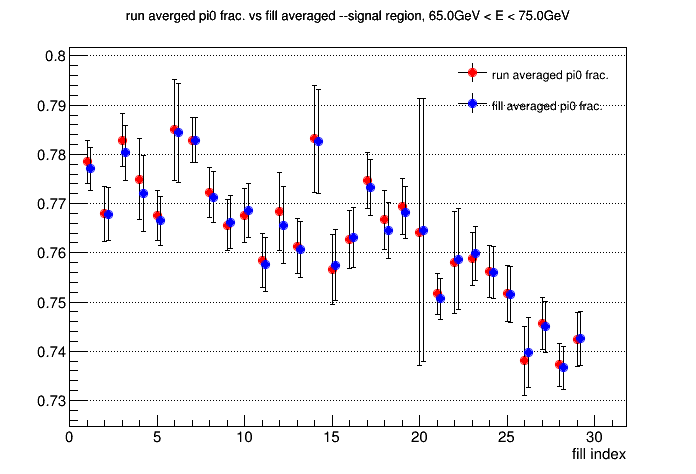
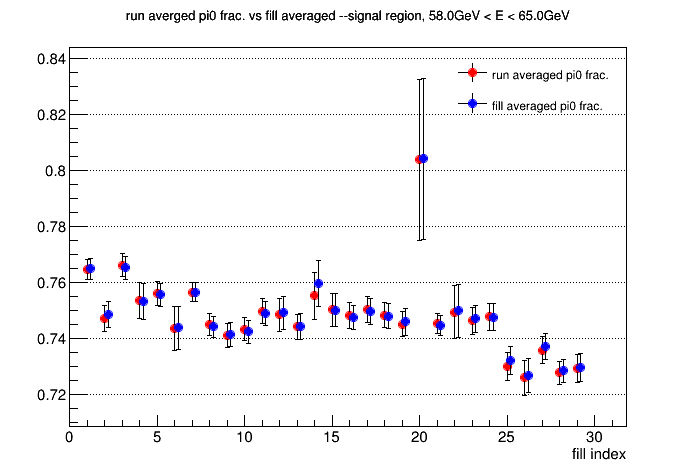
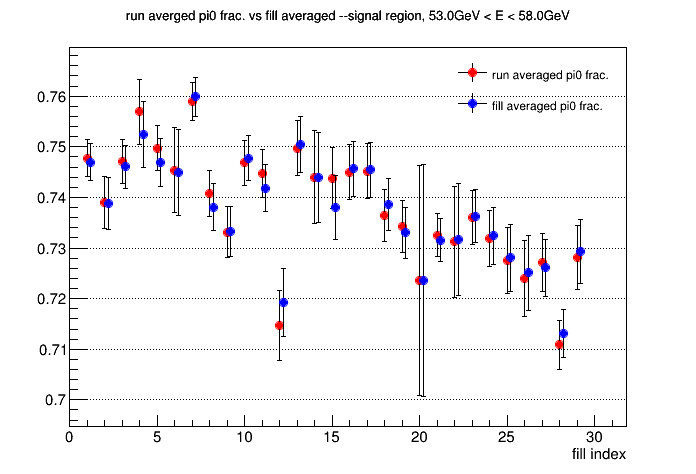
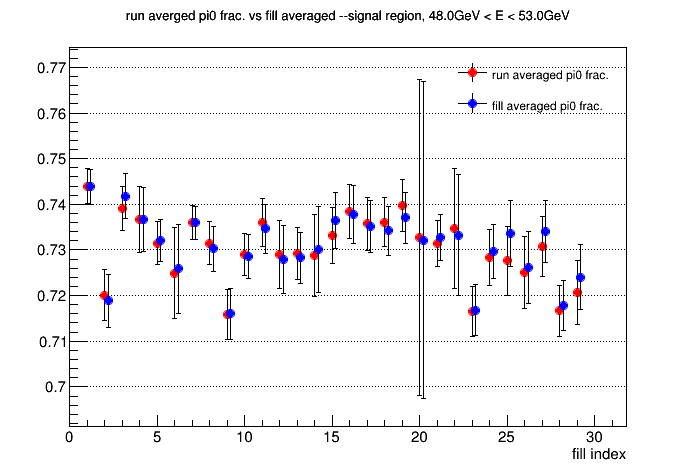
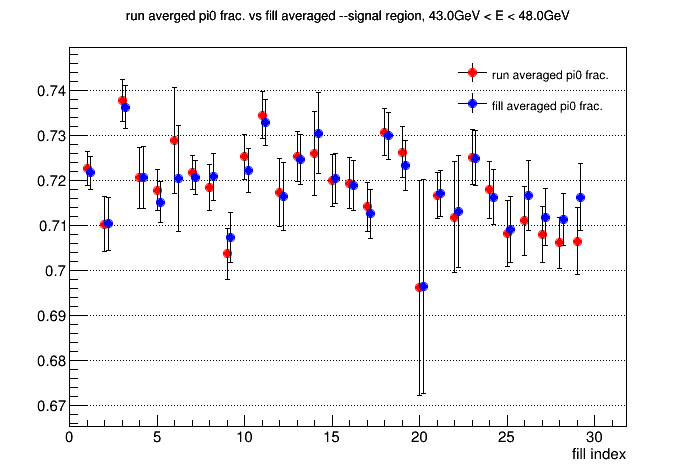
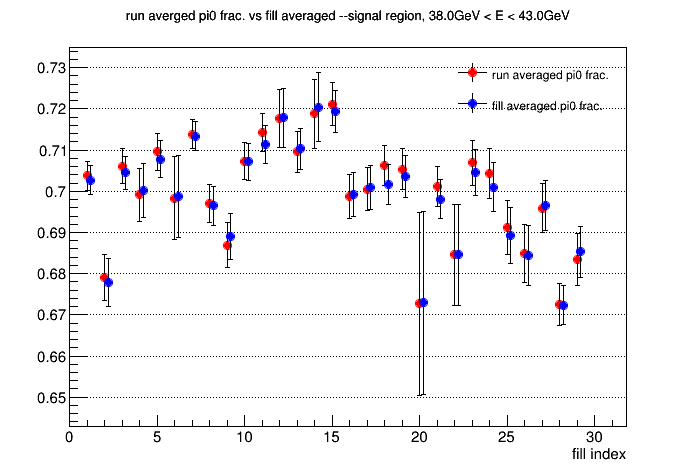
Figure 1. pi0 signal fraction in 0.1 < M < 0.2 GeV, run-by-run average vs fill-by-fill
Since the two methods give almost identical results I decided to use the fractions directly from the mass spectra for an entire fill (blue points).
The signal +bkg. fits for Fill15419 can be found at,
38 GeV < E < 43 GeV
43 GeV < E < 48 GeV
48 GeV < E < 53 GeV
53 GeV < E < 58 GeV
58 GeV < E < 65 GeV
65 GeV < E < 75 GeV
75 GeV < E < 90 GeV
To extract the background-subracted pi0 asymmetry. I use the same method as outlined in,
http://www.star.bnl.gov/protected/spin/yuxip/LBLMeeting_YuxiPan.pdf
Basically the mass range from 0 to 0.3 GeV was divided into 2 regions,
signal region: 0.1 GeV < M < 0.2 GeV
side-band: 0 < M < 0.1 GeV, 0.2 < M < 0.3 GeV
and the total asymmetries for all photon pairs were calculated for the these 2 regions separately. By assuming identical bkg. asymmetries
in signal region and side-band and incorporating pi0 signal fractions in these 2 regions one can solve for pi0 signal asymmetry.
Meanwhile the beam pol. was also calculated fill-by-fill.
The plots below show the extracted pi0 signal asymmetries vs fill index, for 7 energy bins from 38 GeV to 90 GeV
http://www.star.bnl.gov/protected/spin/yuxip/background/7ebins/AnVsFill_7ebins_new.pdf
Then I take the averaged A_N across all fills as the final A_N for a particular energy bin. The plot below show inclusive pi0 A_N vs energy, compared
with Mriganka's 2-photon jet A_N,
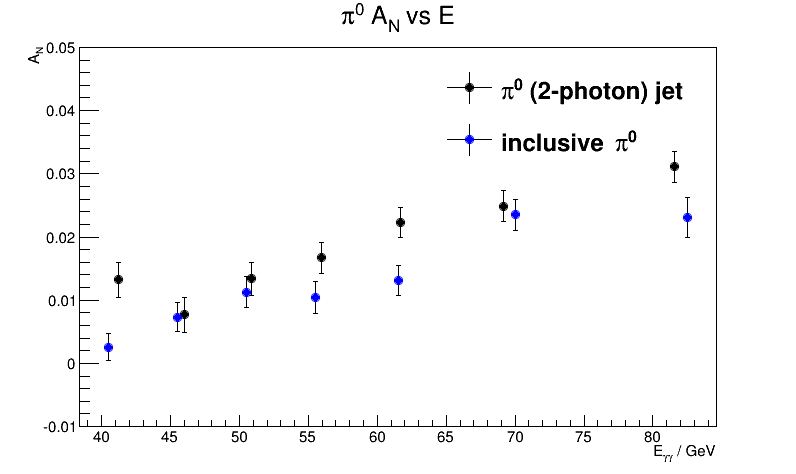
Figure 2. A_N vs E for inclusive pi0 and jet-isolated pi0
To calculate A_N vs pT for a specific energy bins I started out with looking at signal/bkg. fractions over all the data, instead of
fill-by-fill or run-by-run. The first problem I came across was that the peak of the 2-photon mass distribution at large cells (high pT) shifted
too far away from the nominal pi0 mass, as shown below,
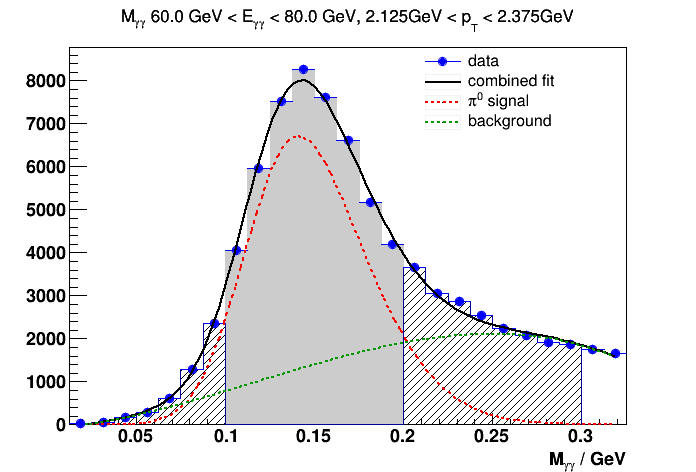
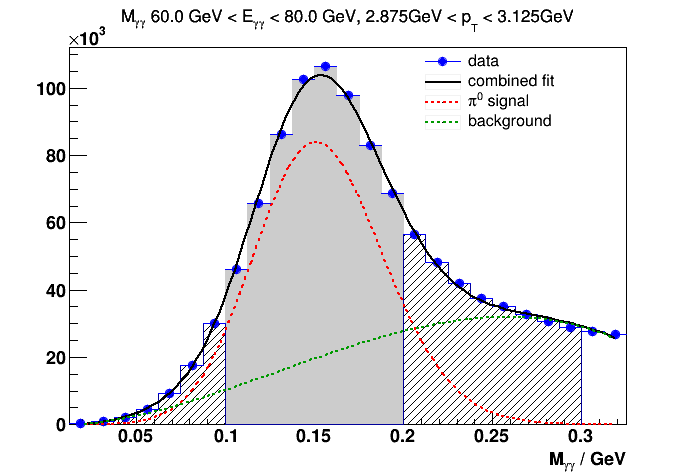
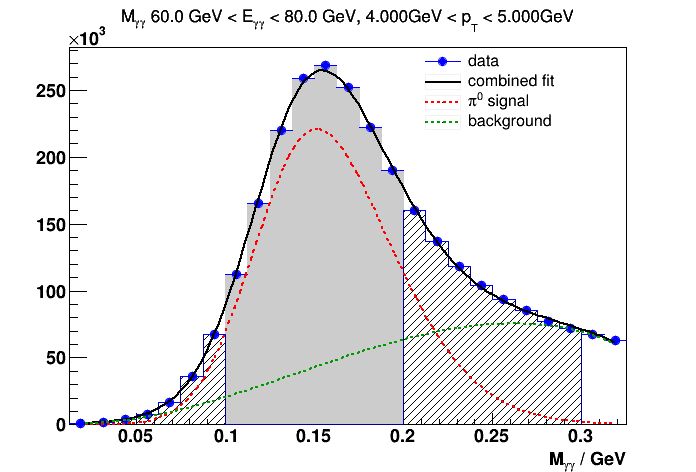
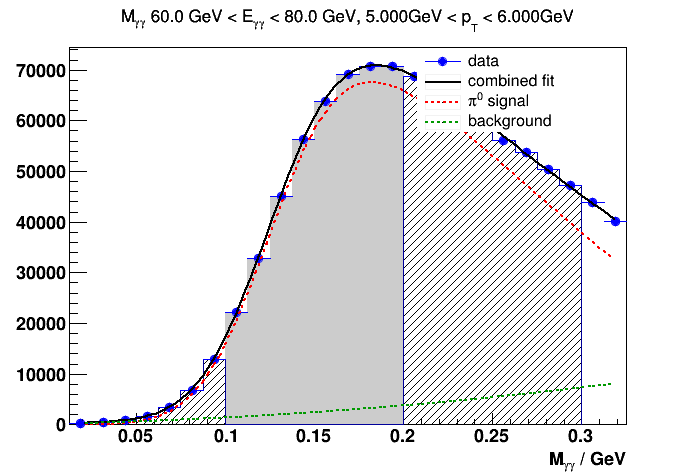
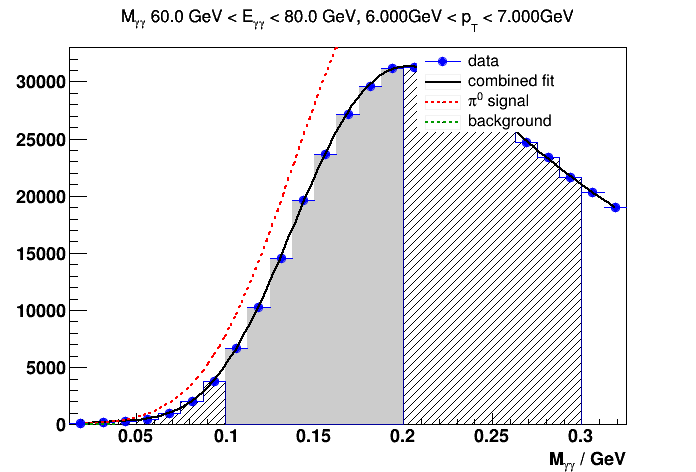
Figure 3. signal + bkg fits for pT bins within 60 GeV < E < 80 GeV
For this particular energy bin, pT = 5 GeV has pseudorapidity ~ 3.3, so pT > 5 GeV is mostly covered by large cells and one
can see a sharp transition in the peak position as well as background levels in going from small to large cells.
The next step is try to evaluate how much of peak shifts come from sysmatics of di-photon separation measurement and how much
comes from the shift of energy scales. And to what extent I can understand this from simulations.
- yuxip's blog
- Login or register to post comments
