- yuxip's home page
- Posts
- 2015
- 2014
- December (2)
- November (1)
- October (2)
- September (6)
- August (2)
- July (1)
- June (3)
- May (4)
- April (1)
- March (2)
- 2013
- December (1)
- November (1)
- October (3)
- September (3)
- August (2)
- July (1)
- June (2)
- May (1)
- April (3)
- March (1)
- February (1)
- January (1)
- 2012
- 2011
- My blog
- Post new blog entry
- All blogs
FMS meeting 09/22/2014 --Collins angle resolutions
I've estimated the resolution of Collins angle by comparing the reconstructed and generated Collins angles in simulation. I took the 1.25M pythia+GSTAR samples
that I generated before and run an anti-kT jet finder with R = 0.7 on generated pythia particles and reconstructed FMS "photons" in parallel. Then I find the pair of
reconstructed photons that are matched to the two daughter photons of a generated pi0, and loop through the particle jet to find the one that contains the generated
pi0, then find the corresponding detector jet that are matched to this particle jet within R < 0.5.
By doing so I can calculate the reconstructed pi0 Collins angle w.r.t the detector jet (with fms "photons"), and generated Collins angle (of the matched MC pi0) w.r.t
the full particle jet.
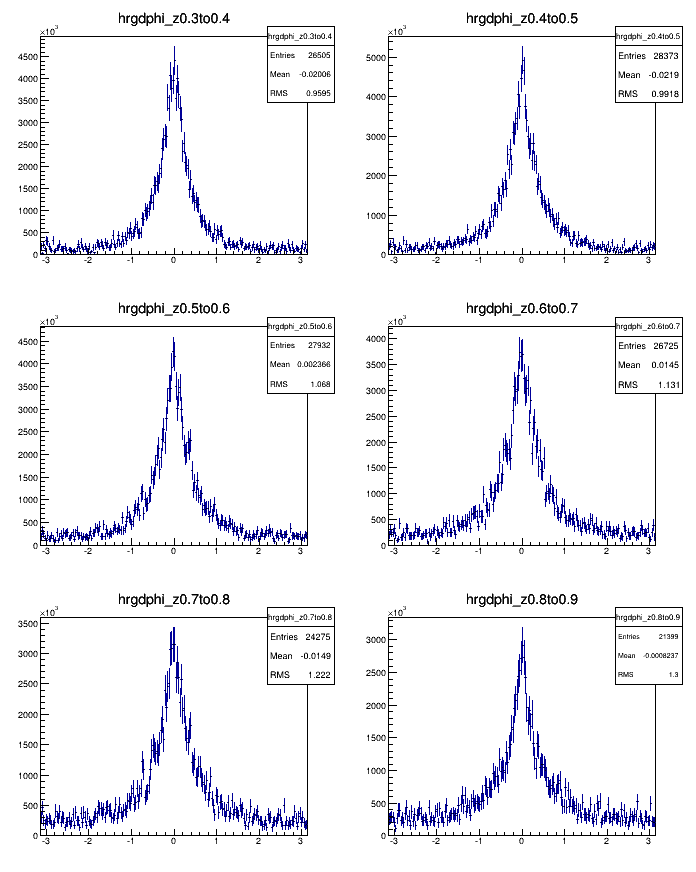
Figure 1 shows the distribution of rec.Collins angle - gen. Collins angle for different z bins.

Figure 1. rec. Collins angle - gen.Collins angle
I did notice that if I make a cut on the distance between the pi0 and the jet axis (Delta_R cut?) the resolution becomes better. But for
now I haven't actually put in this cut since the asymmetries were calculated without any Delta_R cut.
Notice that the distribution is not a simple Gaussian, so I simply use the histogram as a model that describes the resolution function.
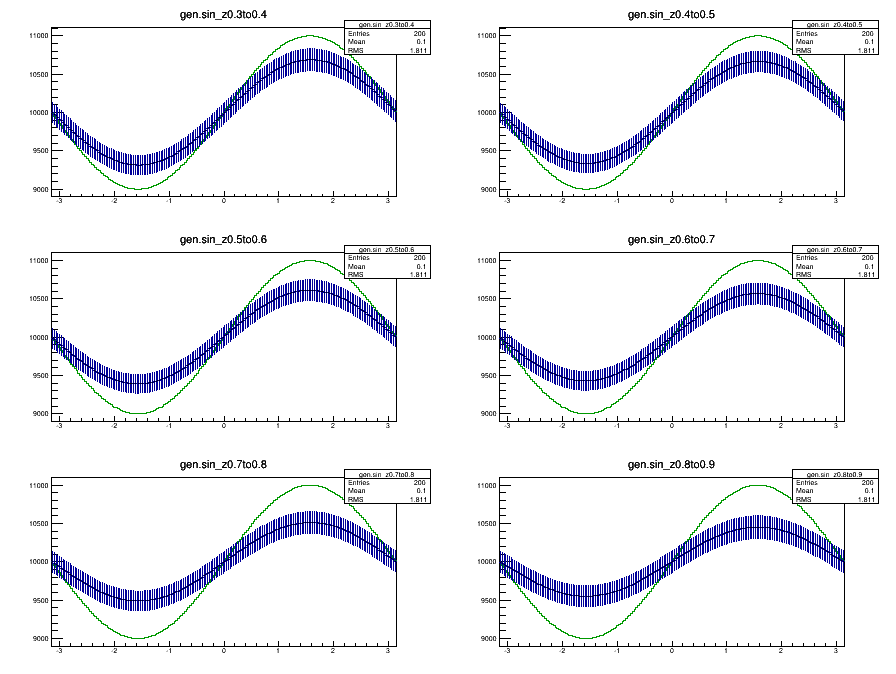
I ran a toy-MC where I manually put in a sinusoidal modulations of yield vs Collins angles (within fine binning), then I smear the yield of
each bin according to the probabilities derived from the resolution function as in figure 1. Figure 2 shows the generated sin functions vs
smeared sin function.

Figure 2. generated sin function (Green, amplitude = 0.1) vs smeared (Blue)
The error of smeared sin function comes from the errors on each bin of the resolution template.
Table 1 shows the amplitude of generated sin function and that of the smeared.
Table 1.
Table 2. show the same dilution factors with Delta_R > 0.1 cut.
Also I noticed that the dilution factor (smeared amplitude / generated) does not really depend on the generated amplitude.
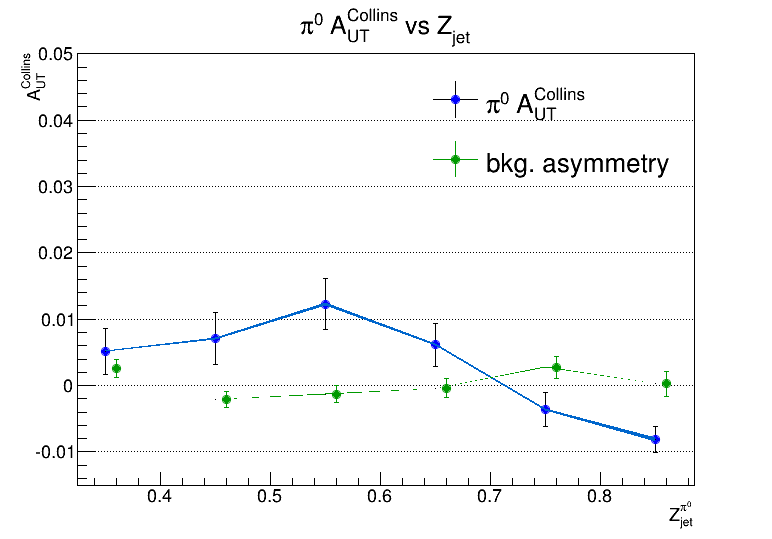
Figure 3 compares the Collins asymmetries vs Z, with and without corrections due to anlge resolutions
.gif)

Figure 3. a). previous Collins asymmetries vs Z, no correction Figure 3 b). with resolution correction
that I generated before and run an anti-kT jet finder with R = 0.7 on generated pythia particles and reconstructed FMS "photons" in parallel. Then I find the pair of
reconstructed photons that are matched to the two daughter photons of a generated pi0, and loop through the particle jet to find the one that contains the generated
pi0, then find the corresponding detector jet that are matched to this particle jet within R < 0.5.
By doing so I can calculate the reconstructed pi0 Collins angle w.r.t the detector jet (with fms "photons"), and generated Collins angle (of the matched MC pi0) w.r.t
the full particle jet.
Figure 1 shows the distribution of rec.Collins angle - gen. Collins angle for different z bins.

Figure 1. rec. Collins angle - gen.Collins angle
I did notice that if I make a cut on the distance between the pi0 and the jet axis (Delta_R cut?) the resolution becomes better. But for
now I haven't actually put in this cut since the asymmetries were calculated without any Delta_R cut.
Notice that the distribution is not a simple Gaussian, so I simply use the histogram as a model that describes the resolution function.
I ran a toy-MC where I manually put in a sinusoidal modulations of yield vs Collins angles (within fine binning), then I smear the yield of
each bin according to the probabilities derived from the resolution function as in figure 1. Figure 2 shows the generated sin functions vs
smeared sin function.

Figure 2. generated sin function (Green, amplitude = 0.1) vs smeared (Blue)
The error of smeared sin function comes from the errors on each bin of the resolution template.
Table 1 shows the amplitude of generated sin function and that of the smeared.
| 0.3-0.4 | 0.4-0.5 | 0.5-0.6 | 0.6-0.7 | 0.7-0.8 | 0.8-0.9 | |
| gen. | 0.1 | 0.1 | 0.1 | 0.1 | 0.1 | 0.1 |
| smeared | 0.0687+/-0.00134 | 0.0665+/-0.00127 | 0.0611+/-0.00128 | 0.0570+/-0.00129 | 0.0511+/-0.00134 | 0.0450+/-0.00141 |
Table 1.
Table 2. show the same dilution factors with Delta_R > 0.1 cut.
| 0.3-0.4 | 0.4-0.5 | 0.5-0.6 | 0.6-0.7 | 0.7-0.8 | 0.8-0.9 | |
| gen. | 0.1 | 0.1 | 0.1 | 0.1 | 0.1 | 0.1 |
| smeared | 0.0730+/-0.00143 | 0.0724+/-0.00139 | 0.0683+/-0.00147 | 0.0656+/-0.0011 | 0.0599+/-0.00205 | 0.0540+/-0.00401 |
Also I noticed that the dilution factor (smeared amplitude / generated) does not really depend on the generated amplitude.
Figure 3 compares the Collins asymmetries vs Z, with and without corrections due to anlge resolutions
.gif)

Figure 3. a). previous Collins asymmetries vs Z, no correction Figure 3 b). with resolution correction
Groups:
- yuxip's blog
- Login or register to post comments
