- yuxip's home page
- Posts
- 2015
- 2014
- December (2)
- November (1)
- October (2)
- September (6)
- August (2)
- July (1)
- June (3)
- May (4)
- April (1)
- March (2)
- 2013
- December (1)
- November (1)
- October (3)
- September (3)
- August (2)
- July (1)
- June (2)
- May (1)
- April (3)
- March (1)
- February (1)
- January (1)
- 2012
- 2011
- My blog
- Post new blog entry
- All blogs
update --pi0 Collins asymmetry on FMS
Here I am documenting some details of the pi0 Collins asymmetries analysis on FMS.
I followed the procedure as outlined in Renee's write-up to caluclate Collins asymmetries.
A_UT vs jet energy
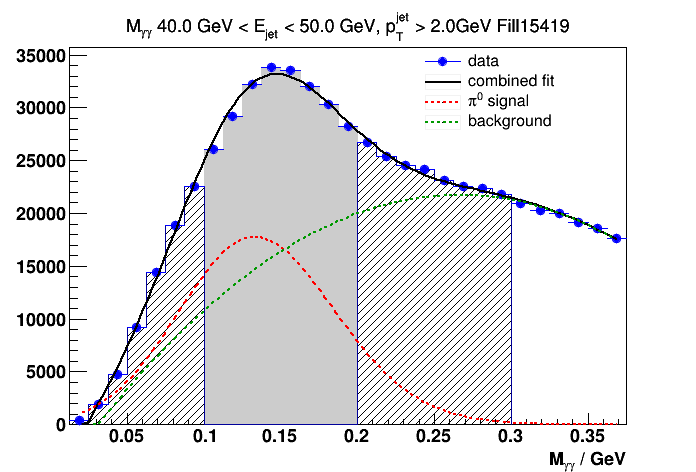
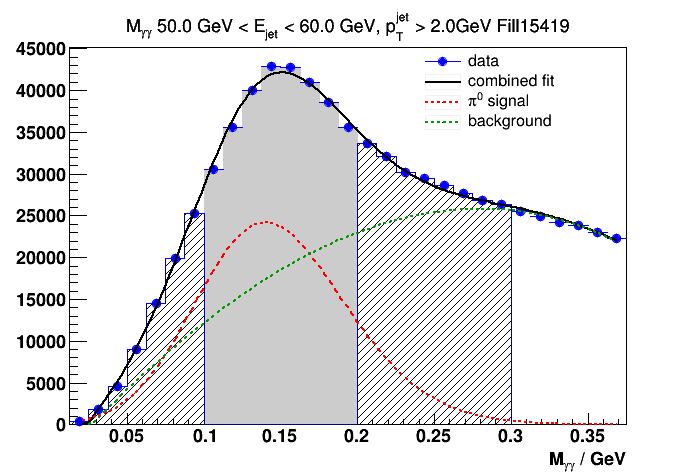
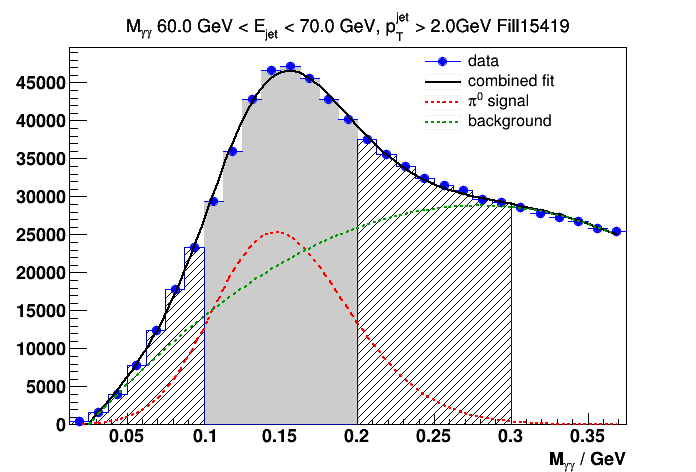
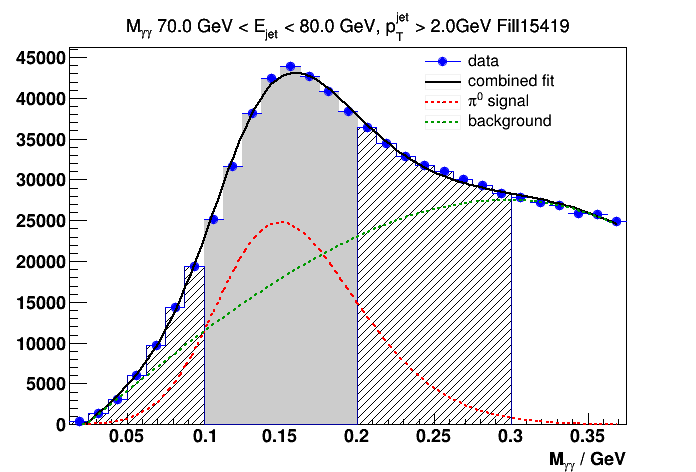
1) diphoton mass with different Z_{#pi0}^{jet} cuts at each energy bin
I found that previously when I fit the diphoton mass distributions I was not using the correct
mass histograms. Now I have made sure all the cuts are correctly implemented I tried different
z cuts to calculate the asymmetries vs energy.
The following plots compare the mass distributions with 0 < z < 0.9 cut to those with
0.3 < z < 0.9 cuts.
0 < z < 0.9 0.3 < z < 0.9
.gif)
.gif)
.gif)
.gif)
.gif)
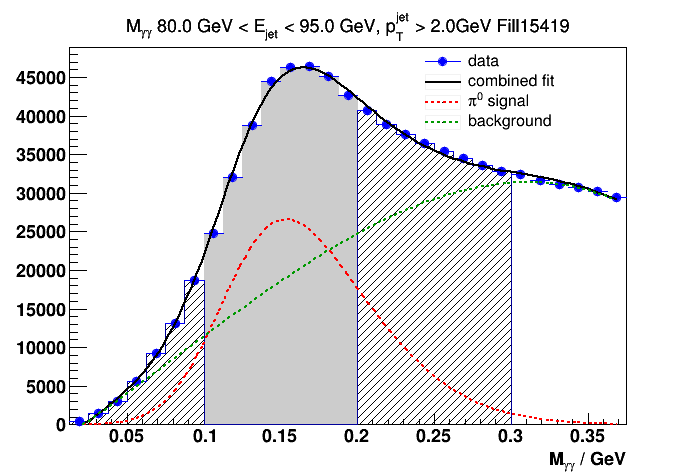
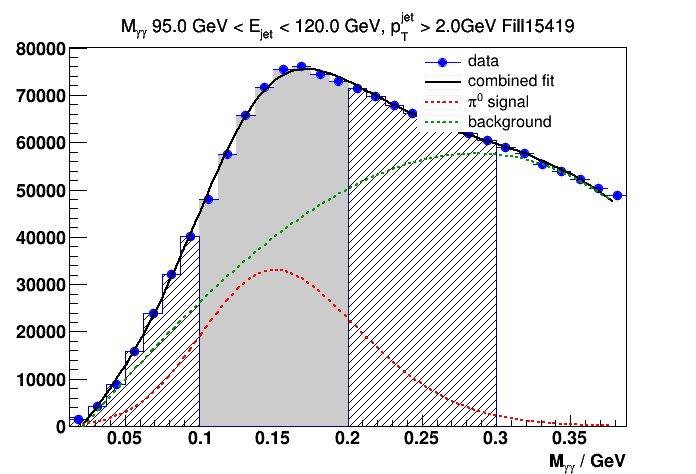
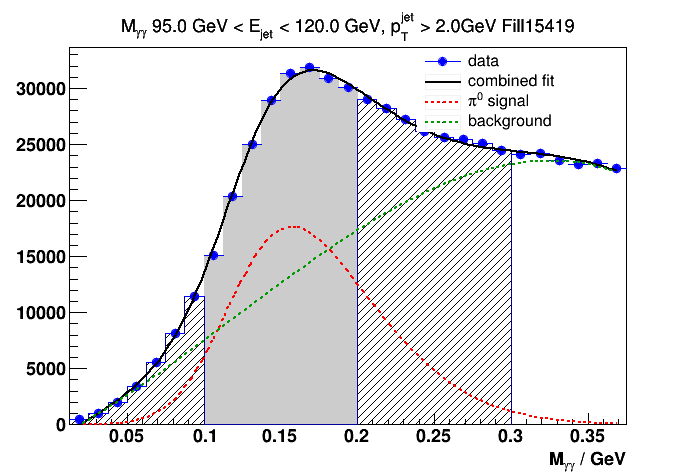
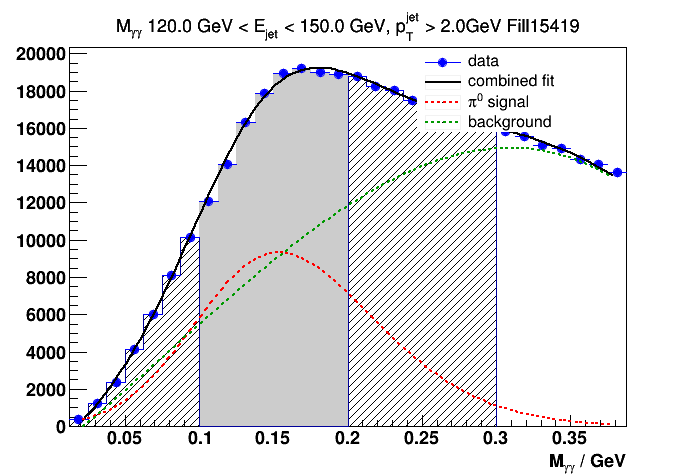
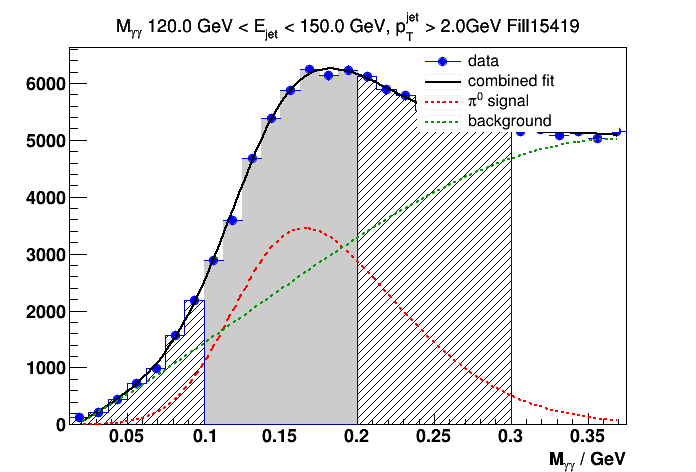
Figure 1. mass distributions with different z cuts
So with 0.3 < z < 0.9 cut the significance of the pi0 signal has improved, but it comes with the price of reudced statistics.
2). Signal fractions in the signal region ( 0.1 < M < 0.2 GeV) and side-bands (0 < M < 0.1 and 0.2 < M < 0.3 GeV)
Figure 2 shows an example of comparing the signal fractions vs fill index for the above z cuts. The comparison for all 7 energy bins can be found
here for 0 < z < 0.9 and here for 0.3 < z < 0.9.
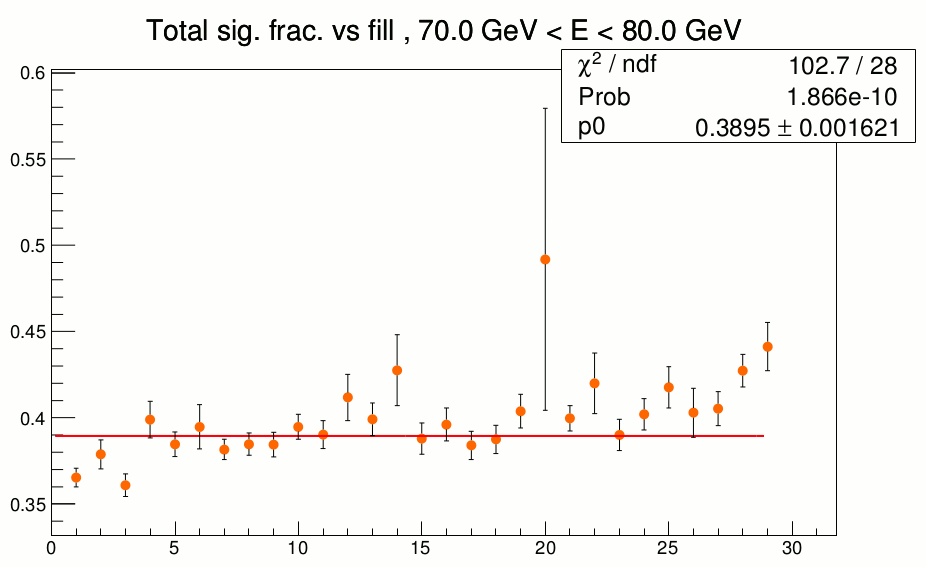
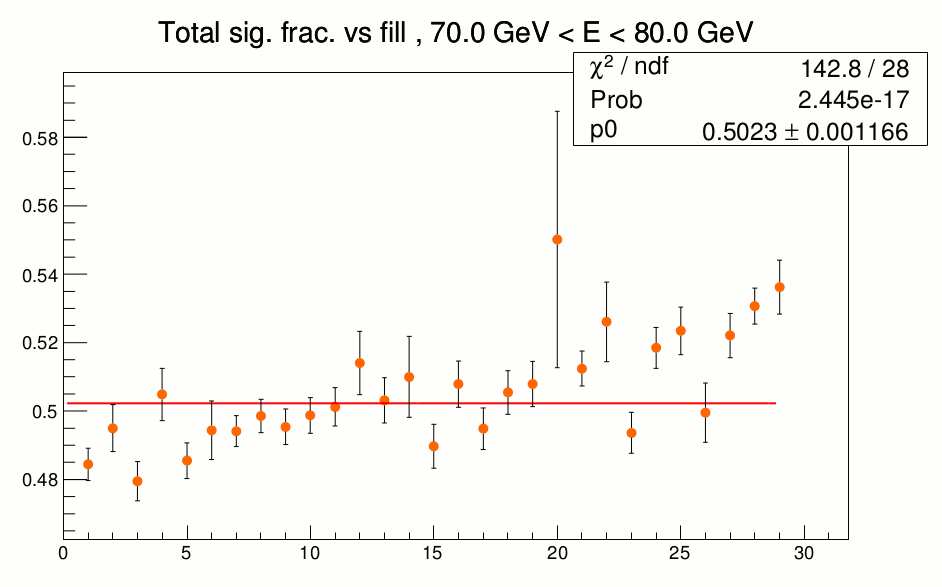
Figure 2 a). signal fraction vs fill index for 0 < z < 0.9 Figure 2 b). signal fraction vs fill index for 0.3 < z < 0.9
The signal fractions in side-bands can be found at here for 0 < z < 0.9, and here for 0.3 < z < 0.9.
3). Background subtracted asymmetries vs jet energy
fill-by-fill total asymmetries in the signal region (for 0 < z < 0.9) can be found at,
http://www.star.bnl.gov/protected/spin/yuxip/pi0jet/ebins/z0to0.9/z0to0.9TotAsySigVsFill_7ebins.pdf
and total asymmetries in the side-bands (for 0 < z < 0.9),
http://www.star.bnl.gov/protected/spin/yuxip/pi0jet/ebins/z0to0.9/z0to0.9TotAsyBkgVsFill_7ebins.pdf
Figure 3 shows the fill averaged total asymmetries in the signal region and sidebands,
.gif)
.gif)
Figure 3 a). total asy. in signal region (0.1 < M < 0.2 GeV) Figure 3 b). total asy. in sidebands ( 0 < M < 0.1 U 0.2 < M < 0.3GeV)
Finally the fill-by-fill background subtracted asymmetries for each energy bin can be found at,
http://www.star.bnl.gov/protected/spin/yuxip/pi0jet/ebins/z0to0.9/AnVsFill_7ebins.pdf for 0 < z < 0.9
and,
http://www.star.bnl.gov/protected/spin/yuxip/pi0jet/ebins/z0.3to0.9/AnVsFill_7ebins.pdf for 0.3 < z < 0.9.
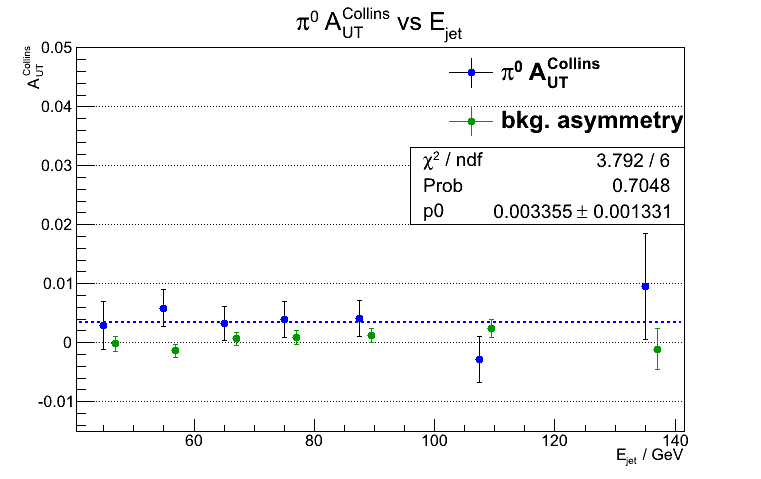
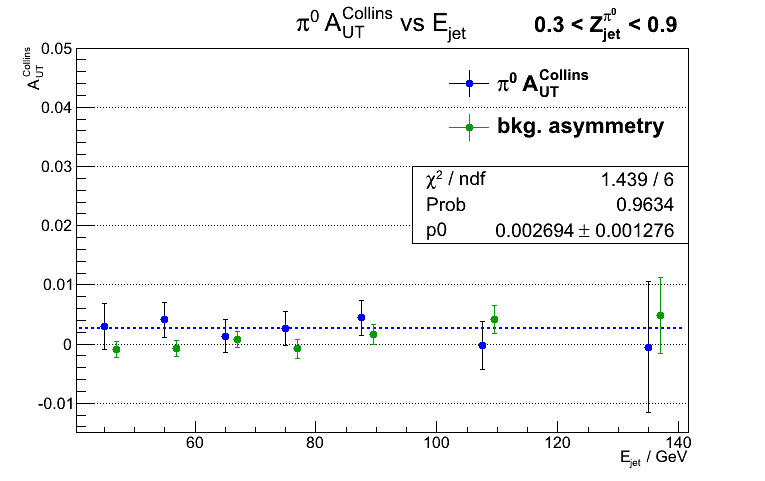
Figure 4 a). A_UT vs jet energy with 0 < z < 0.9 cut Figure 4 b). A_UT vs jet energy with 0.3 < z < 0.9 cut
A_UT vs z_{#pi^{0}}^{jet}
Due to the overwhelming combinatorial background at low z I only looked at A_UT for z above 0.4, with jet pT > 2.0 GeV, 2.8 < jet eta < 4.0.
Figure 4 shows the corresponding mass distributions for 5 z bins from 0.4 to 0.9.
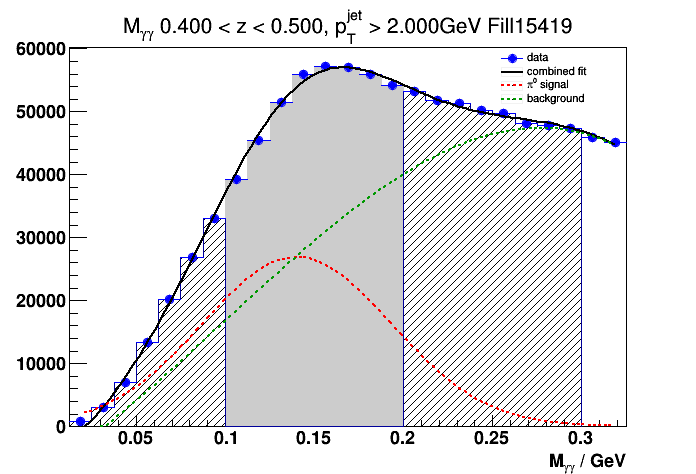
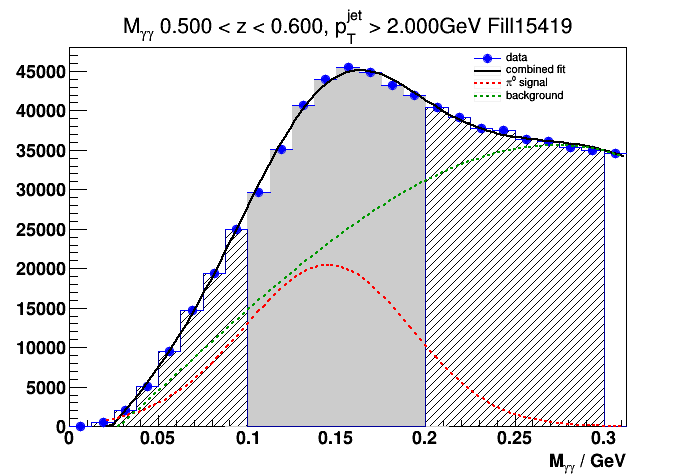
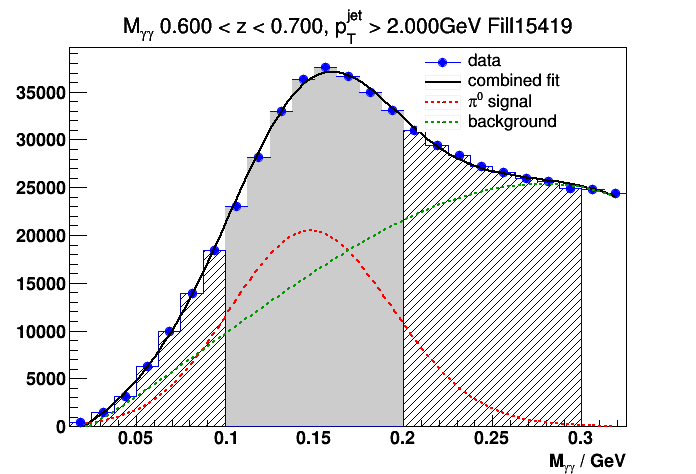
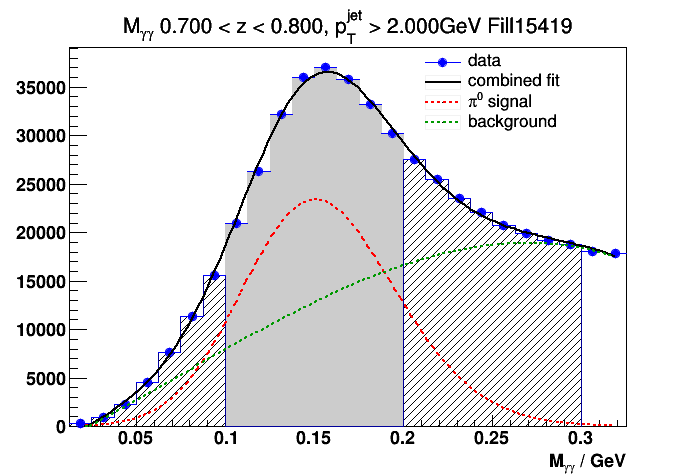
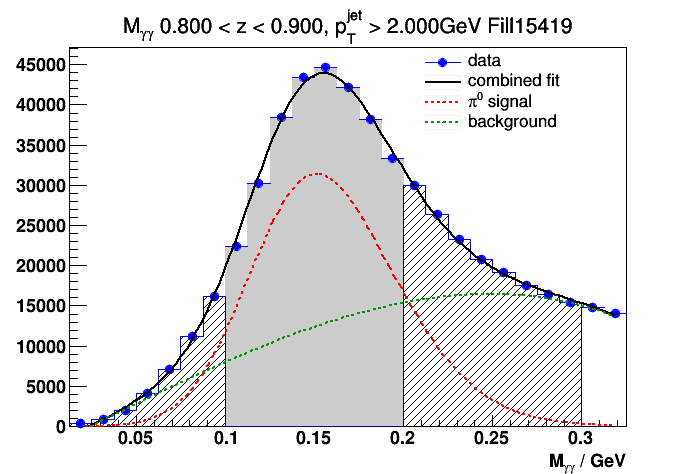
Figure 5). mass distributions for different z cuts
The signal fraction in signal region vs fill index can be found at,
http://www.star.bnl.gov/protected/spin/yuxip/pi0jet/zbins/SigFracVsFill_zbins.pdf
and the signal fraction in side-band is at,
http://www.star.bnl.gov/protected/spin/yuxip/pi0jet/zbins/SbFracVsFill_zbins.pdf
Background substracted asy. vs fill can be found at,
http://www.star.bnl.gov/protected/spin/yuxip/pi0jet/zbins/AnVsFill_zbins.pdf
Figure 5 shows the background subtracted Collins asymmetry vs z,
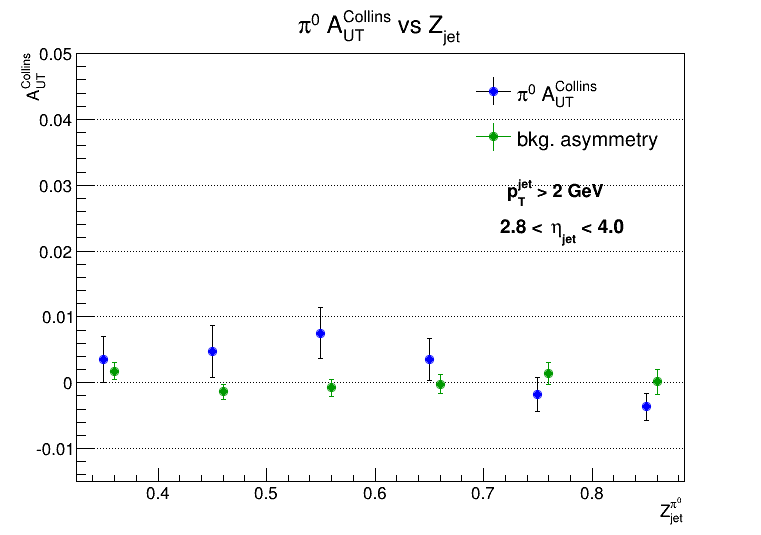
Figure 6). A_UT vs z
I followed the procedure as outlined in Renee's write-up to caluclate Collins asymmetries.
A_UT vs jet energy
1) diphoton mass with different Z_{#pi0}^{jet} cuts at each energy bin
I found that previously when I fit the diphoton mass distributions I was not using the correct
mass histograms. Now I have made sure all the cuts are correctly implemented I tried different
z cuts to calculate the asymmetries vs energy.
The following plots compare the mass distributions with 0 < z < 0.9 cut to those with
0.3 < z < 0.9 cuts.
0 < z < 0.9 0.3 < z < 0.9
.gif)

.gif)

.gif)

.gif)

.gif)


Figure 1. mass distributions with different z cuts
So with 0.3 < z < 0.9 cut the significance of the pi0 signal has improved, but it comes with the price of reudced statistics.
2). Signal fractions in the signal region ( 0.1 < M < 0.2 GeV) and side-bands (0 < M < 0.1 and 0.2 < M < 0.3 GeV)
Figure 2 shows an example of comparing the signal fractions vs fill index for the above z cuts. The comparison for all 7 energy bins can be found
here for 0 < z < 0.9 and here for 0.3 < z < 0.9.


Figure 2 a). signal fraction vs fill index for 0 < z < 0.9 Figure 2 b). signal fraction vs fill index for 0.3 < z < 0.9
The signal fractions in side-bands can be found at here for 0 < z < 0.9, and here for 0.3 < z < 0.9.
3). Background subtracted asymmetries vs jet energy
fill-by-fill total asymmetries in the signal region (for 0 < z < 0.9) can be found at,
http://www.star.bnl.gov/protected/spin/yuxip/pi0jet/ebins/z0to0.9/z0to0.9TotAsySigVsFill_7ebins.pdf
and total asymmetries in the side-bands (for 0 < z < 0.9),
http://www.star.bnl.gov/protected/spin/yuxip/pi0jet/ebins/z0to0.9/z0to0.9TotAsyBkgVsFill_7ebins.pdf
Figure 3 shows the fill averaged total asymmetries in the signal region and sidebands,
.gif)
.gif)
Figure 3 a). total asy. in signal region (0.1 < M < 0.2 GeV) Figure 3 b). total asy. in sidebands ( 0 < M < 0.1 U 0.2 < M < 0.3GeV)
Finally the fill-by-fill background subtracted asymmetries for each energy bin can be found at,
http://www.star.bnl.gov/protected/spin/yuxip/pi0jet/ebins/z0to0.9/AnVsFill_7ebins.pdf for 0 < z < 0.9
and,
http://www.star.bnl.gov/protected/spin/yuxip/pi0jet/ebins/z0.3to0.9/AnVsFill_7ebins.pdf for 0.3 < z < 0.9.


Figure 4 a). A_UT vs jet energy with 0 < z < 0.9 cut Figure 4 b). A_UT vs jet energy with 0.3 < z < 0.9 cut
A_UT vs z_{#pi^{0}}^{jet}
Due to the overwhelming combinatorial background at low z I only looked at A_UT for z above 0.4, with jet pT > 2.0 GeV, 2.8 < jet eta < 4.0.
Figure 4 shows the corresponding mass distributions for 5 z bins from 0.4 to 0.9.


Figure 5). mass distributions for different z cuts
The signal fraction in signal region vs fill index can be found at,
http://www.star.bnl.gov/protected/spin/yuxip/pi0jet/zbins/SigFracVsFill_zbins.pdf
and the signal fraction in side-band is at,
http://www.star.bnl.gov/protected/spin/yuxip/pi0jet/zbins/SbFracVsFill_zbins.pdf
Background substracted asy. vs fill can be found at,
http://www.star.bnl.gov/protected/spin/yuxip/pi0jet/zbins/AnVsFill_zbins.pdf
Figure 5 shows the background subtracted Collins asymmetry vs z,

Figure 6). A_UT vs z
Groups:
- yuxip's blog
- Login or register to post comments
