run20 19.6 QA
Updated on Fri, 2020-07-10 12:20. Originally created by yuzhang1 on 2020-07-09 00:31.
data path: /star/data05/pwg_tasks/picoDst_Run19_19p6_Calib
run by run QA plots : https://drive.google.com/file/d/1YAKEpXk98NisI777GfIPe2N29fOGU2bv/view?usp=sharing
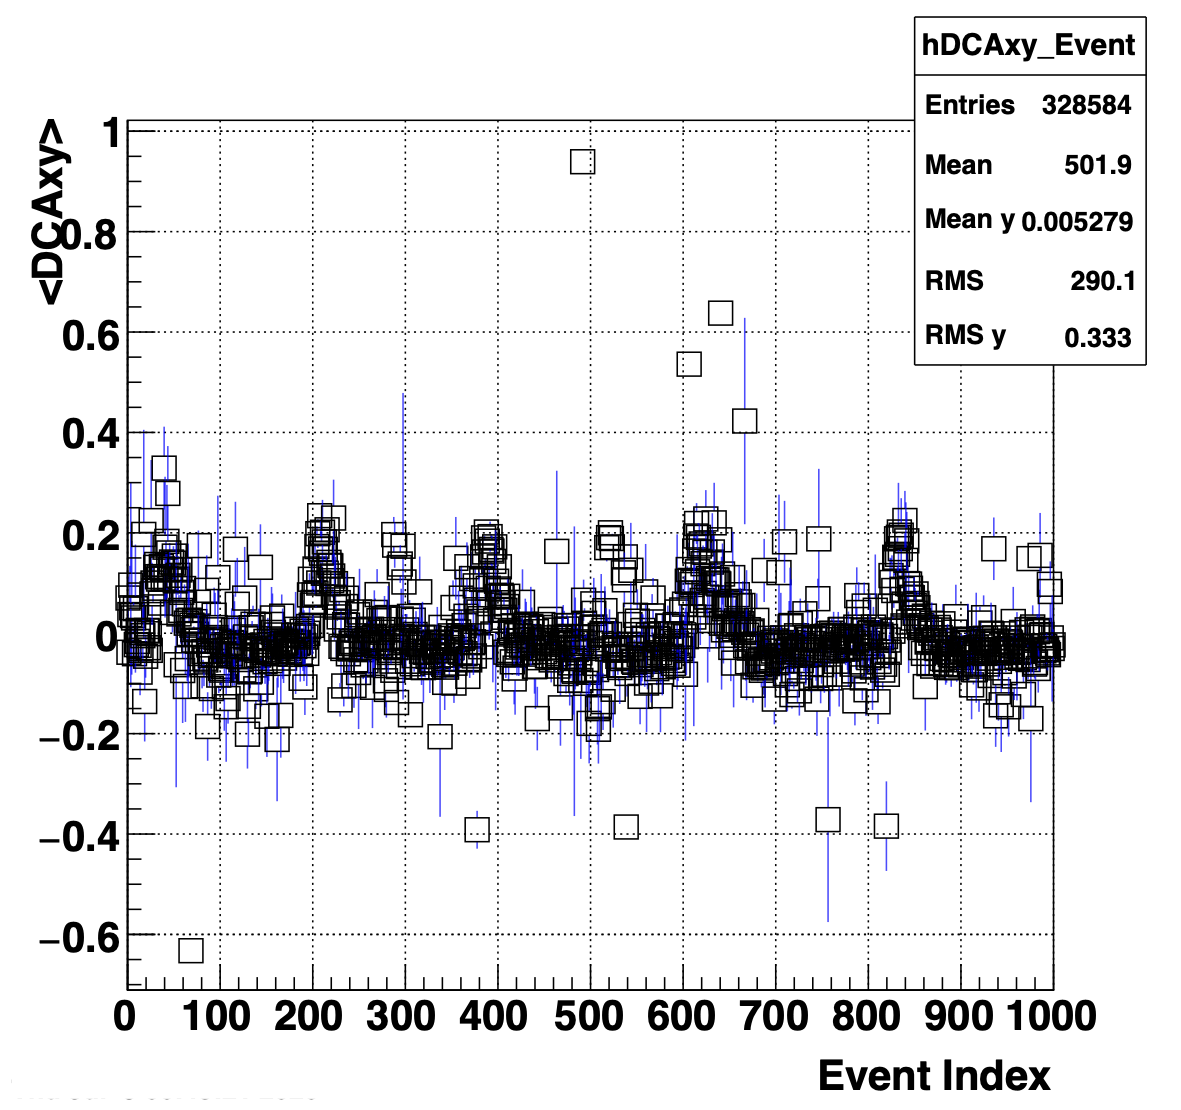
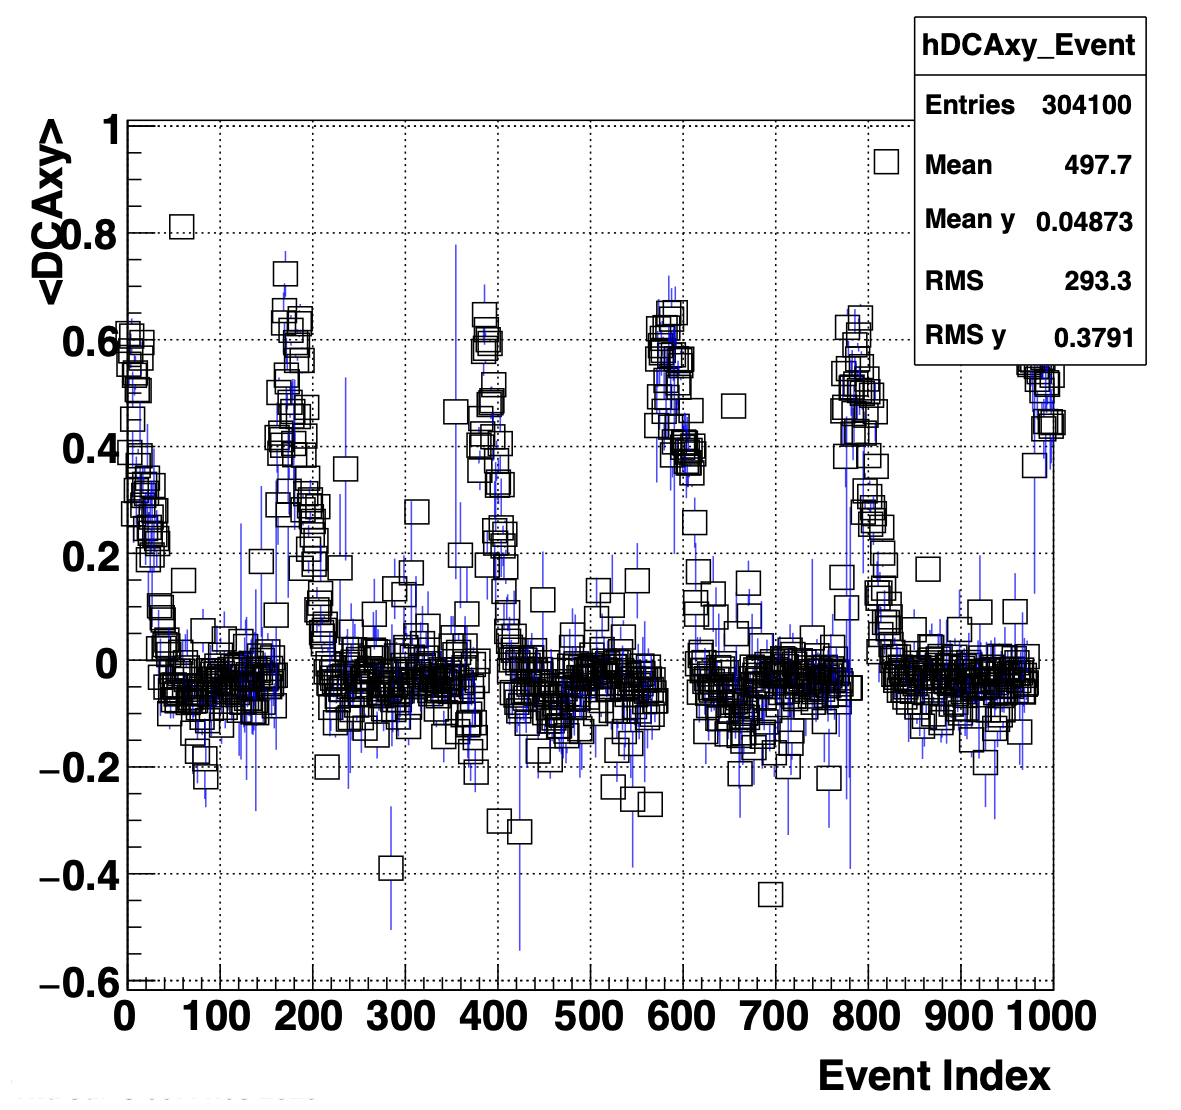
1. Many runs show periodic rise of averaged signed DCAxy at event wise plot.
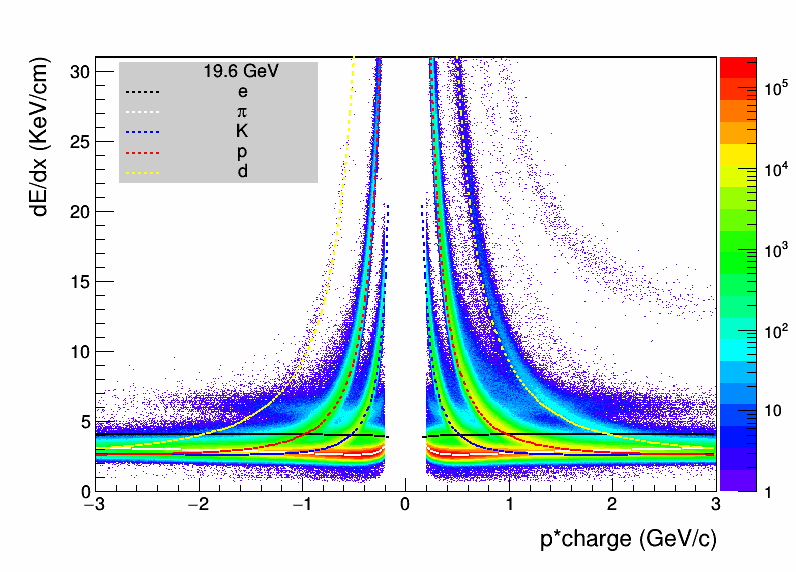
2. TPC dedx energy loss plots show deviation from theoretical lines.
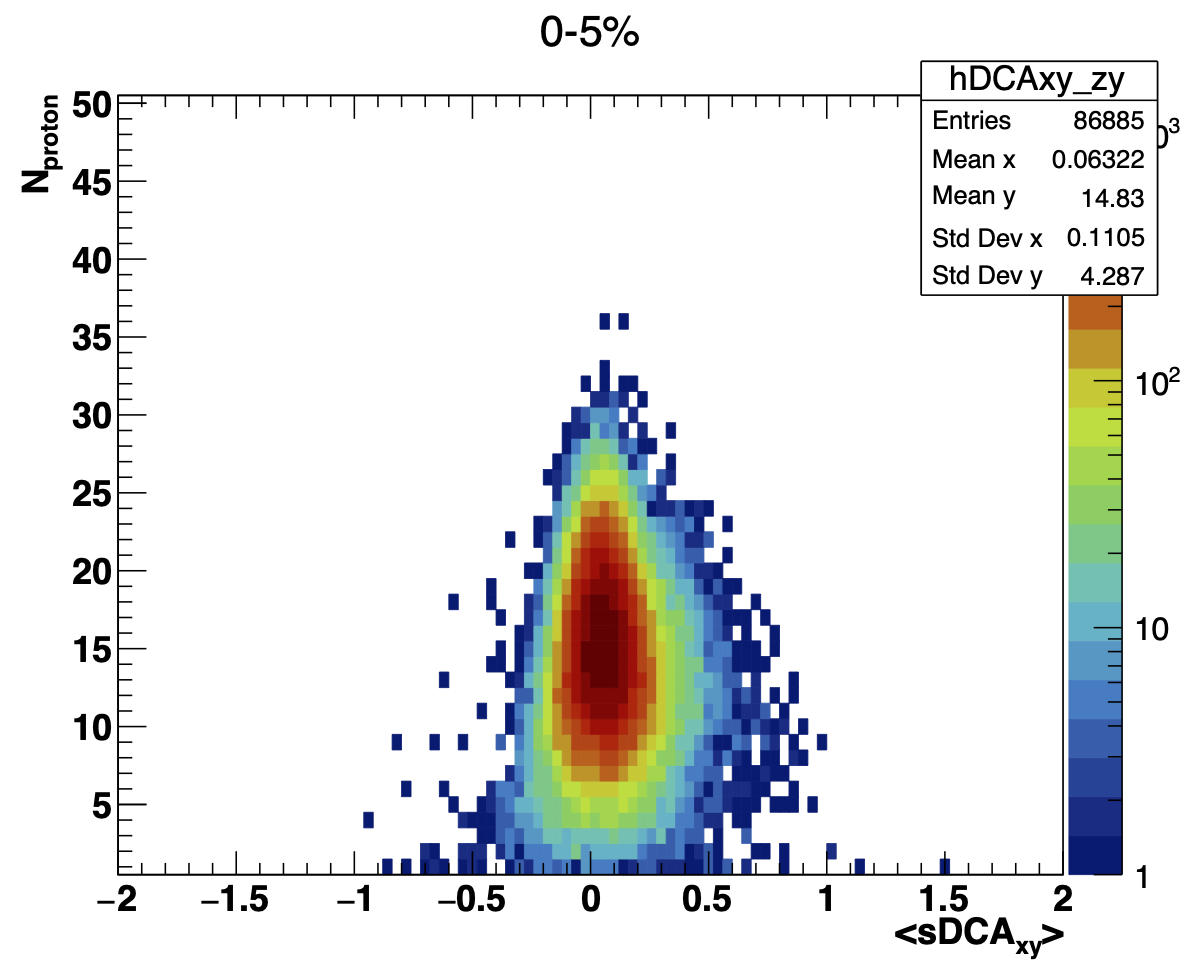
3. signed DCAxy vs Nproton at 0-5%
»
- yuzhang1's blog
- Login or register to post comments