PPV test w/ and w/o BTOF with run12 real data update
Xin's original study can be found at http://drupal.star.bnl.gov/STAR/subsys/tof/ppv-with-use-btof
Xin found that the TOF status table is not up-to-date, and suggested this could be solved somehow by hard code in StiPPVertex.
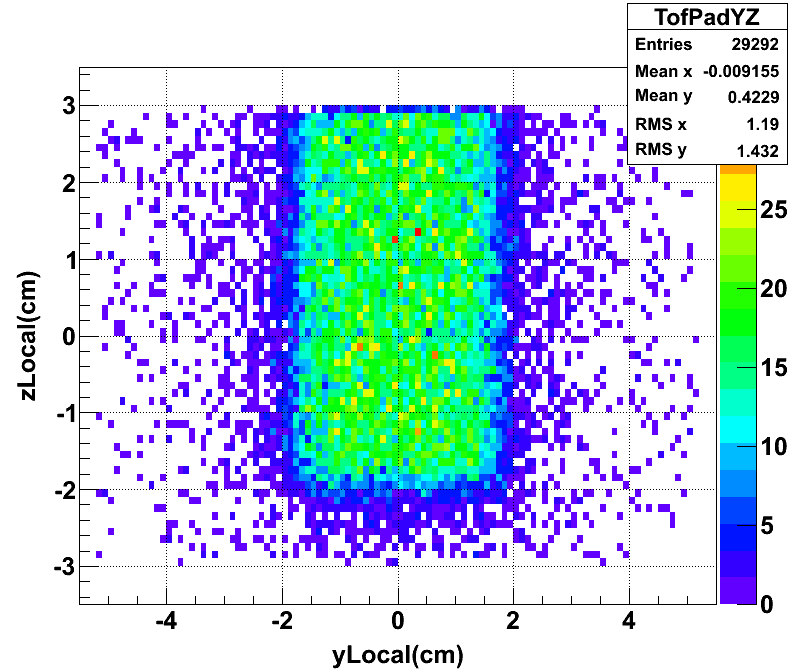
This update conserns this change. yLocal and zLocal distributions are added.
The data file using in this test is (run first 10k events)
st_physics_13050038_raw_1010001.daq
Chain options pp2012a,mtdDat,btof,fmsDat,VFPPVnoCTB,beamline,BEmcChkStat,Corr4,OSpaceZ2,OGridLeak3D,-hitfilt
Production was done using the DEV lib on 3/16/2012.
The following results (except those of yLocal and zLocal) are using events marked by VPDMB-nobsmd trigger, we have 6423 such events.
PPV efficiency is defined as (events with at least one good vertex) / (total number of events).
efficiency=(wTOF 4280/6423 = 66.64% ), (woTOF 3064/6423 = 47.7%)
I also list some numbers below.
wTOF: (events with good Vz & |Vz-VpdVz|<6cm) / (total) = 2702/6423 = 42.07%
woTOF: (events with good Vz & |Vz-VpdVz|<6cm) / (total) = 1918/6423 = 29.86%
Fig:1 The 2-D correlation plot of # of good vertices in each event for PPV w/ TOF and w/o TOF.
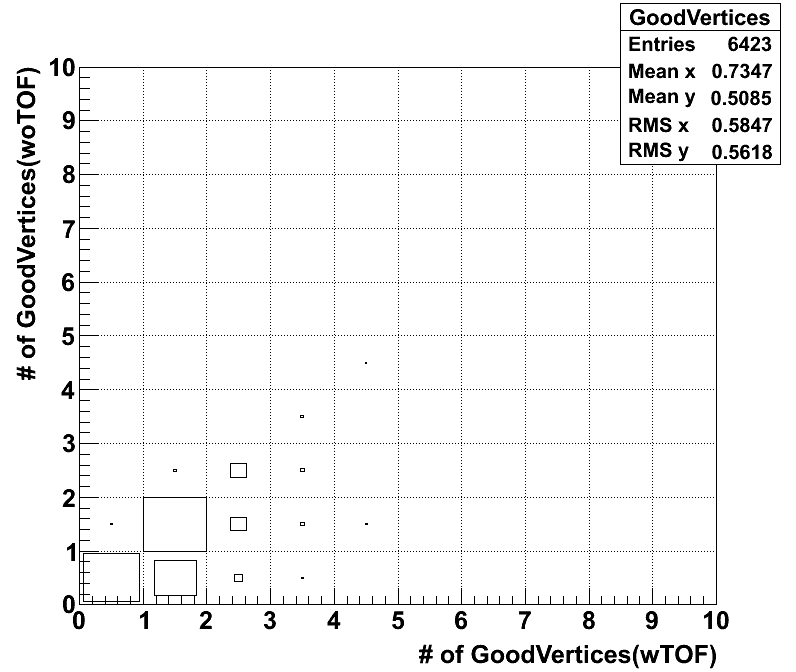
Fig. 2: The ranking distributions for all vertices from PPV w/ and w/o TOF
.gif)
Fig. 3: Vz correlation for the good vertex (ranking>0) with the highest ranking in each event for PPV w/ and w/o.
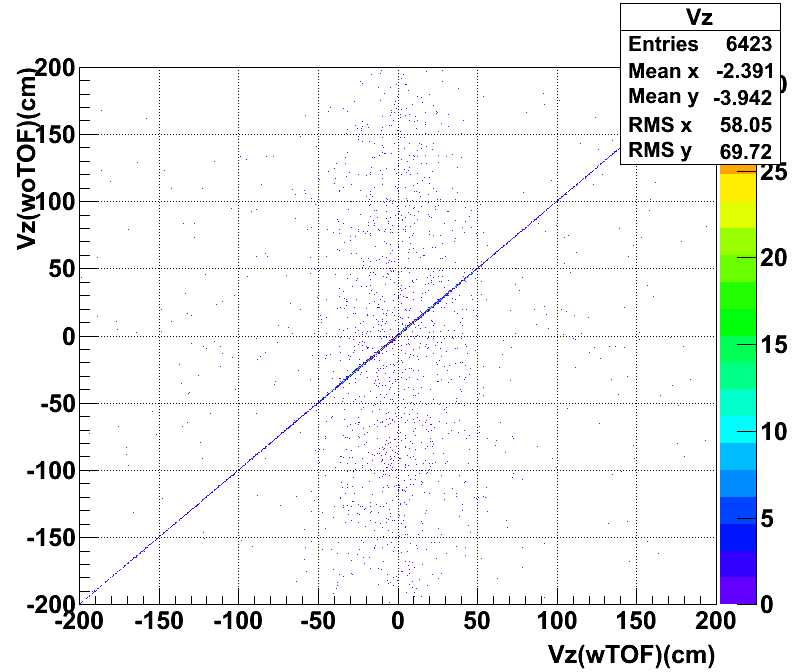
Fig. 4: Vz difference between vertices found in PPV w/ TOF and w/o TOF for the first good vertex in each event if any.
.gif)
Fig. 5: The first good vefrtex Vz and VpdVz difference in w/ and w/o TOF scenarios.
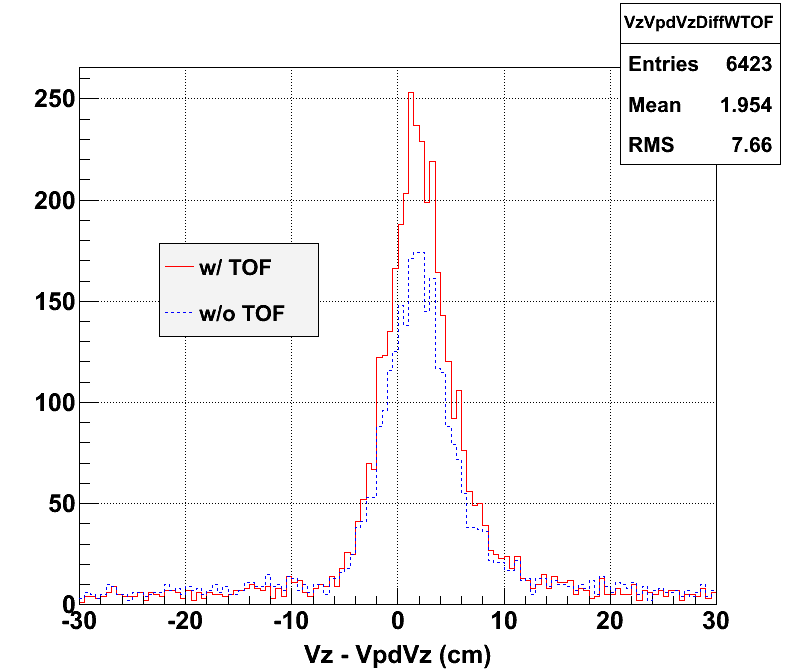
Fig.6: The first good vefrtex Vz and VpdVz 2D correlation for PPV w/ TOF
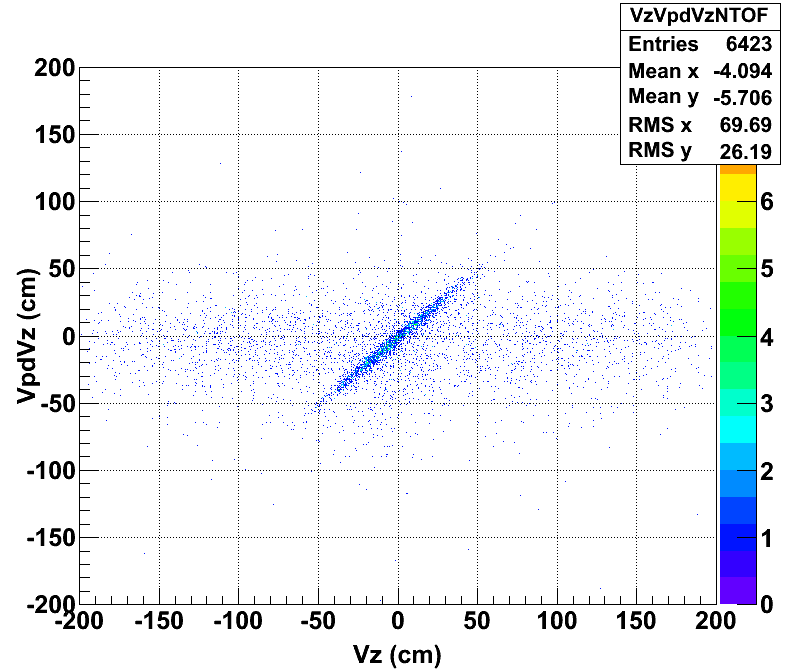
Fig.7: The first good vefrtex Vz and VpdVz 2D correlation for PPV w/o TOF
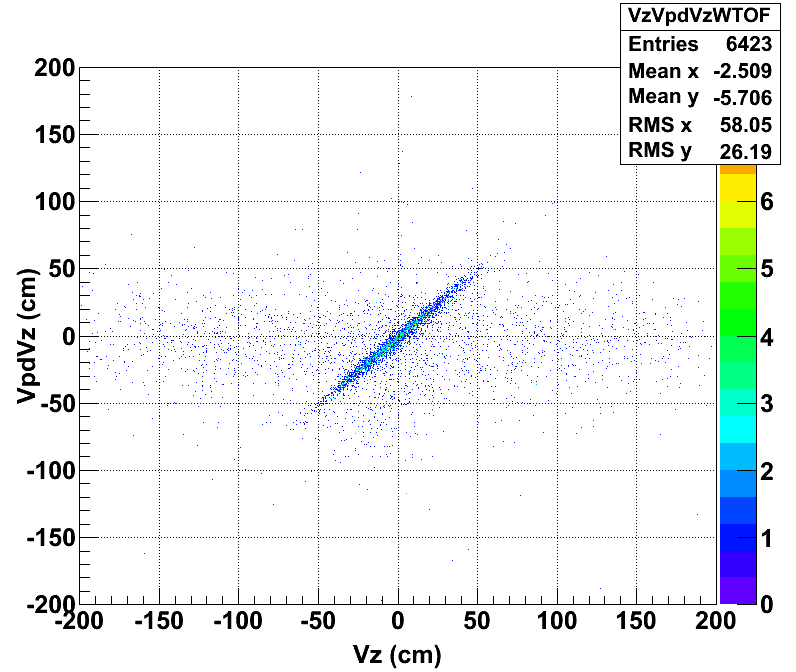
Fig. 8: yLocal-zLocal 2-D distribution w/ BTOF production. (globalTracks, no triggerID is selected on event level)
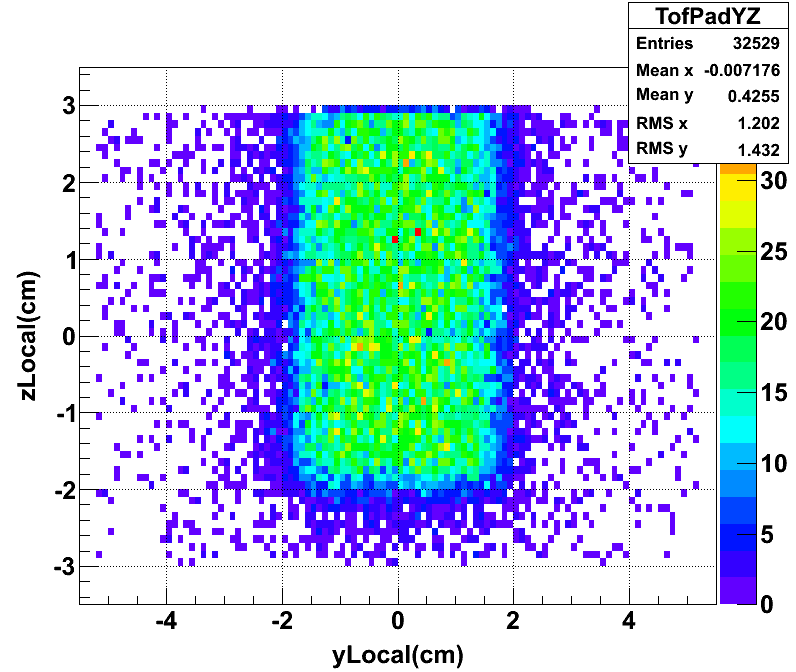
Fig. 9: yLocal-zLocal 2-D distribution w/o BTOF production. (globalTracks, no triggerID is selected on event level)
- yyang's blog
- Login or register to post comments
