PPV test w/ and w/o BTOF with run12 real data (three trigger rate levels)
Xin's original study can be found at http://drupal.star.bnl.gov/STAR/subsys/tof/ppv-with-use-btof
Xin found that the TOF status table is not up-to-date, and suggested this could be solved somehow by hard code in StiPPVertex(Done).
Three runs at different luminosity levels are selected in this test. For each run, only one daq file, and first 15000 events are used,
events are required to be marked by vpdmb-nobsmd trigger.
Production chain optoins(http://www.star.bnl.gov/devcgi/dbProdOptionRetrv.pl) are
pp2012a,mtdDat,btof,fmsDat,VFPPVnoCTB,beamline,BEmcChkStat,Corr4,OSpaceZ2,OGridLeak3D,-hitfilt
Production was done using the DEV lib on 3/18/2012.
Definition:
good Vz : vertex with positive ranking
PPV efficiency = (events with good Vz & |Vz-VpdVz|<6cm) / (total)
PPV efficiency2 = (events with good Vz) / (total)
| runnumber | trigger rate | #events | #events vpdmb_nobsmd | daqfile::nevents | PPV efficiency | PPV efficiency2 | ||||
| 13069013 | 14407.40 | 3M | 0.64M | st_physics_13069013_raw_4040005.daq::15905 |
|
|
||||
| 13069023 | 9314.20 | 3.3M | 1.32M | st_physics_13069023_raw_3010005.daq::21086 |
|
|
||||
| 13068037 | 6280.70 | 2.76M | 1.98M | st_physics_13068037_raw_5020005.daq::26025 |
|
|
Note: All the entries in the event levet plots below are the number of vpdmb-nobsmd triggerd events, which are also used in the ppv efficiency calculation.
Fig:1 The 2-D correlation plot of # of good vertices in each event for PPV w/ TOF and w/o TOF. .gif)
Fig. 2: The ranking distributions for all vertices from PPV w/ and w/o TOF. Tha Maximum value is normalized to unity.
![]()
Fig. 3: Vz correlation for the good vertex (ranking>0) with the highest ranking in each event for PPV w/ and w/o.
.gif)
Fig. 4: Vz difference between vertices found in PPV w/ TOF and w/o TOF for the first good vertex in each event if any.
.gif)
Fig. 5: The first good vefrtex Vz and VpdVz difference in w/ and w/o TOF scenarios.
.gif)
Fig.6: The first good vefrtex Vz and VpdVz 2D correlation for PPV w/ TOF
.gif)
Fig.7: The first good vefrtex Vz and VpdVz 2D correlation for PPV w/o TOF
.gif)
Fig. 8: yLocal-zLocal 2-D distribution w/ BTOF production. (globalTracks, no triggerID is selected on event level)
.gif)
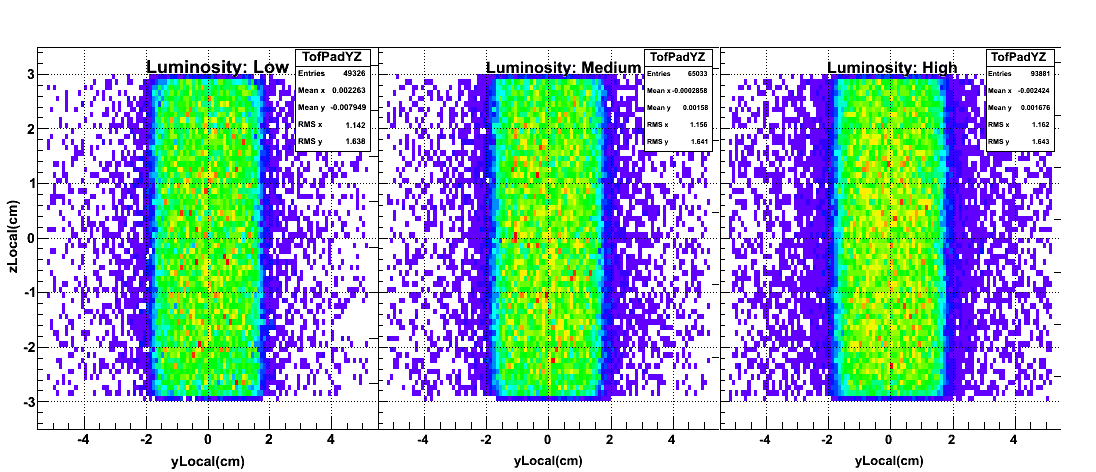
Fig. 9: yLocal-zLocal 2-D distribution w/o BTOF production. (globalTracks, no triggerID is selected on event level)
.gif)
----------------------------------------------------------------------------------------------------------------
The following update concerns the update of DEV lib. This is done in 4/4/2012
| runnumber | trigger rate | #events | #events vpdmb_nobsmd | daqfile::nevents | PPV efficiency | PPV efficiency2 | ||||
| 13069013 | 14407.40 | 3M | 0.64M | st_physics_13069013_raw_4040005.daq::15905 |
|
|
||||
| 13069023 | 9314.20 | 3.3M | 1.32M | st_physics_13069023_raw_3010005.daq::21086 |
|
|
||||
| 13068037 | 6280.70 | 2.76M | 1.98M | st_physics_13068037_raw_5020005.daq::26025 |
|
|
Note: All the entries in the event levet plots below are the number of vpdmb-nobsmd triggerd events, which are also used in the ppv efficiency calculation.
Fig:1 The 2-D correlation plot of # of good vertices in each event for PPV w/ TOF and w/o TOF.
Fig. 2: The ranking distributions for all vertices from PPV w/ and w/o TOF. Tha Maximum value is normalized to unity.
funnyR=log(rank+/-1e6)+offset.
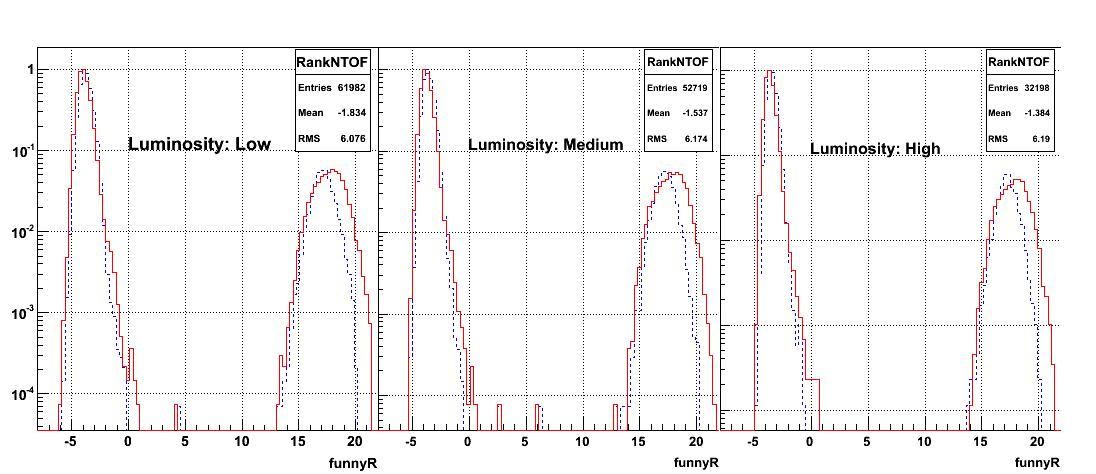
Fig. 3: Vz correlation for the good vertex (ranking>0) with the highest ranking in each event for PPV w/ and w/o.
Fig. 4: Vz difference between vertices found in PPV w/ TOF and w/o TOF for the first good vertex in each event if any.
Fig. 5: The first good vefrtex Vz and VpdVz difference in w/ and w/o TOF scenarios.
Fig.6: The first good vefrtex Vz and VpdVz 2D correlation for PPV w/ TOF
Fig.7: The first good vefrtex Vz and VpdVz 2D correlation for PPV w/o TOF
Fig. 8: yLocal-zLocal 2-D distribution w/ BTOF production. (globalTracks, no triggerID is selected on event level)
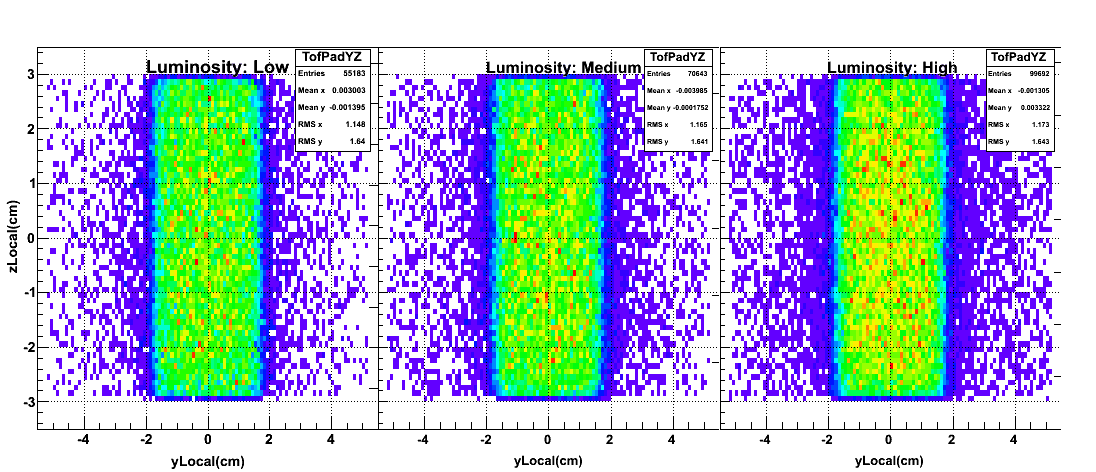
Fig. 9: yLocal-zLocal 2-D distribution w/o BTOF production. (globalTracks, no triggerID is selected on event level)
- yyang's blog
- Login or register to post comments