ppv test w/ and w/o BTOF with run12 real data (three trigger rate levels and serveral triggers)
Done with help of Xin Dong and Frank Geurts.
Xin's original study can be found at http://drupal.star.bnl.gov/STAR/subsys/tof/ppv-with-use-btof
Xin found that the TOF status table is not up-to-date, and suggested this could be solved somehow by hard code in StiPPVertex(Done).
Three runs at different luminosity levels are selected in this test. Data samples are selected large enough, as to statistical errors are quite small.
Production chain optoins(http://www.star.bnl.gov/devcgi/dbProdOptionRetrv.pl) are
pp2012a,mtdDat,btof,fmsDat,VFPPVnoCTB,beamline,BEmcChkStat,Corr4,OSpaceZ2,OGridLeak3D,-hitfilt
The test of ppv w/o tof was done at STAR_LEVEL=SL12d, but, for ppv w/ tof, it was done at STAR_LEVEL=SL12b.
Definition:
good Vz : vertex with positive ranking
PPV efficiency = (events with good Vz & |Vz-VpdVz|<6cm) / (total)
PPV efficiency2 = (events with good Vz) / (total)
By "total", it means all events marked by certain trigger.
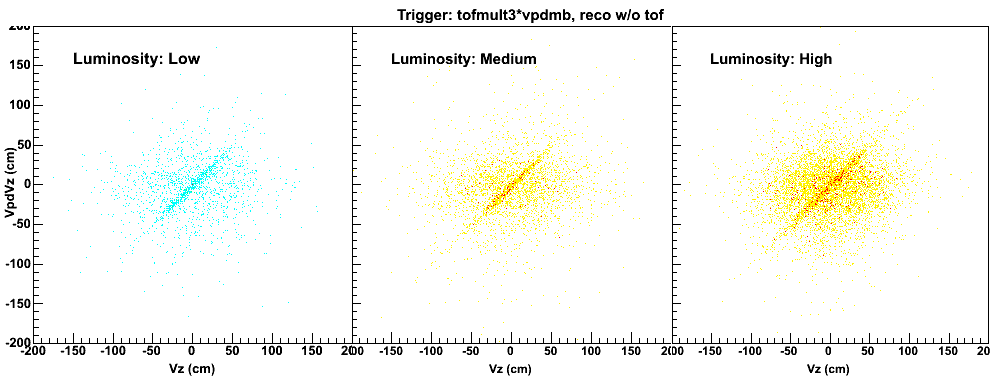
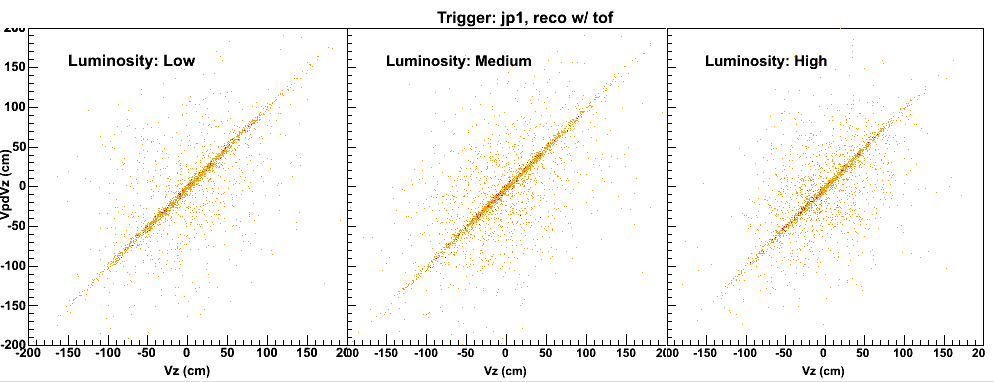
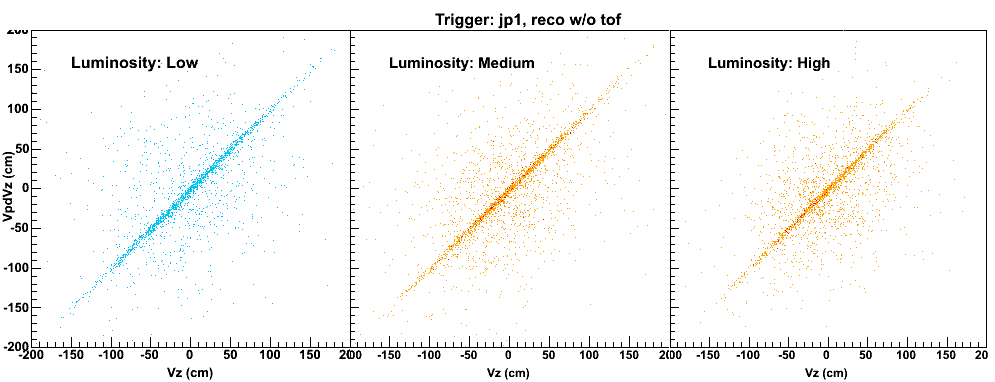
| Luminosity | runnumber | trigger rate | #events | #events(test sample) |
| High | 13069013 | 14407.40 | 3M | ~0.78M |
| Medium | 13069023 | 9314.20 | 3.3M | ~1M |
| Low | 13068037 | 6280.70 | 2.76M | ~1.3M |
Fig 1. PPV efficiency
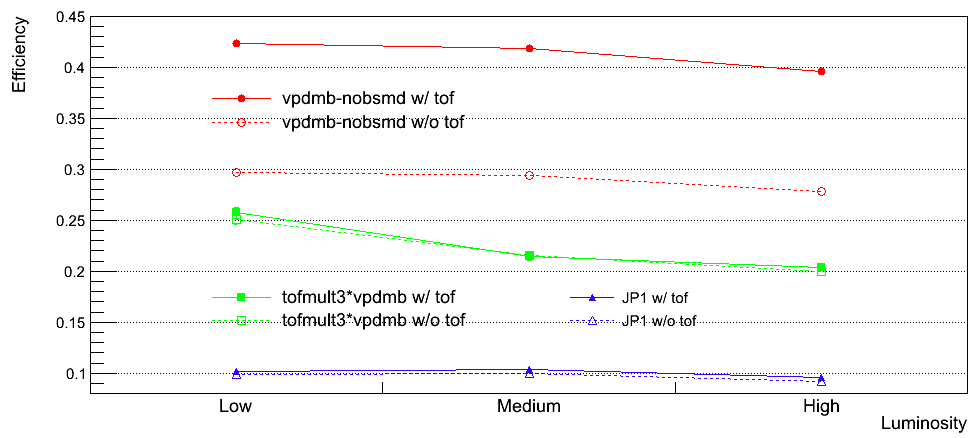
Fig 2. PPV efficiency2
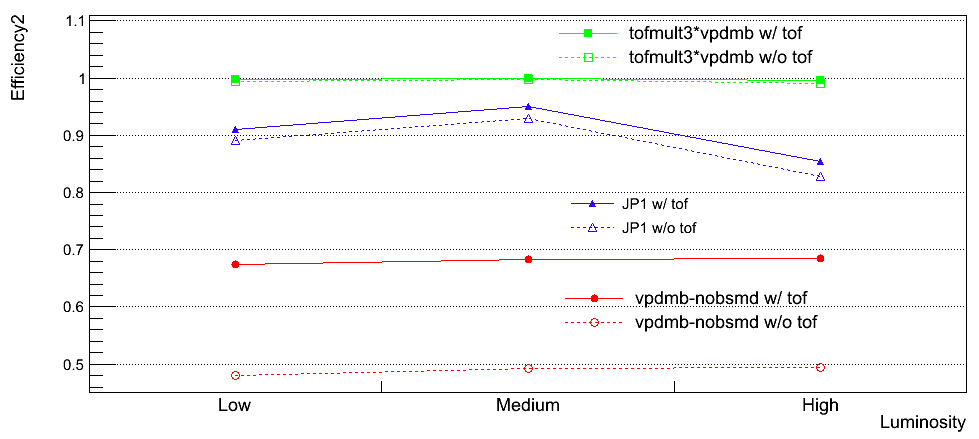
Fig 3. The 2-D correlation plot of # of good vertices in each event for PPV w/ TOF and w/o TOF.
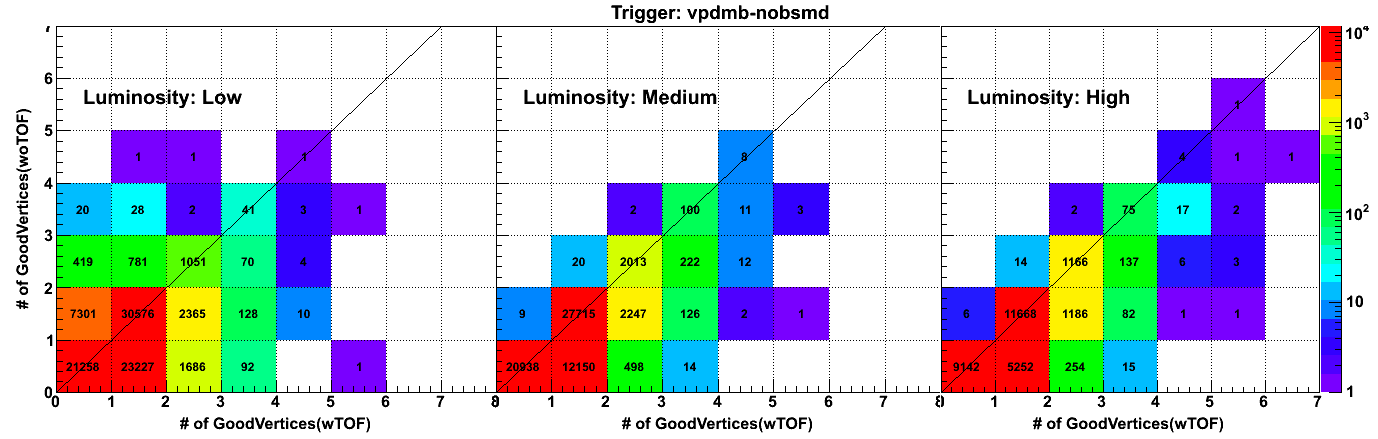
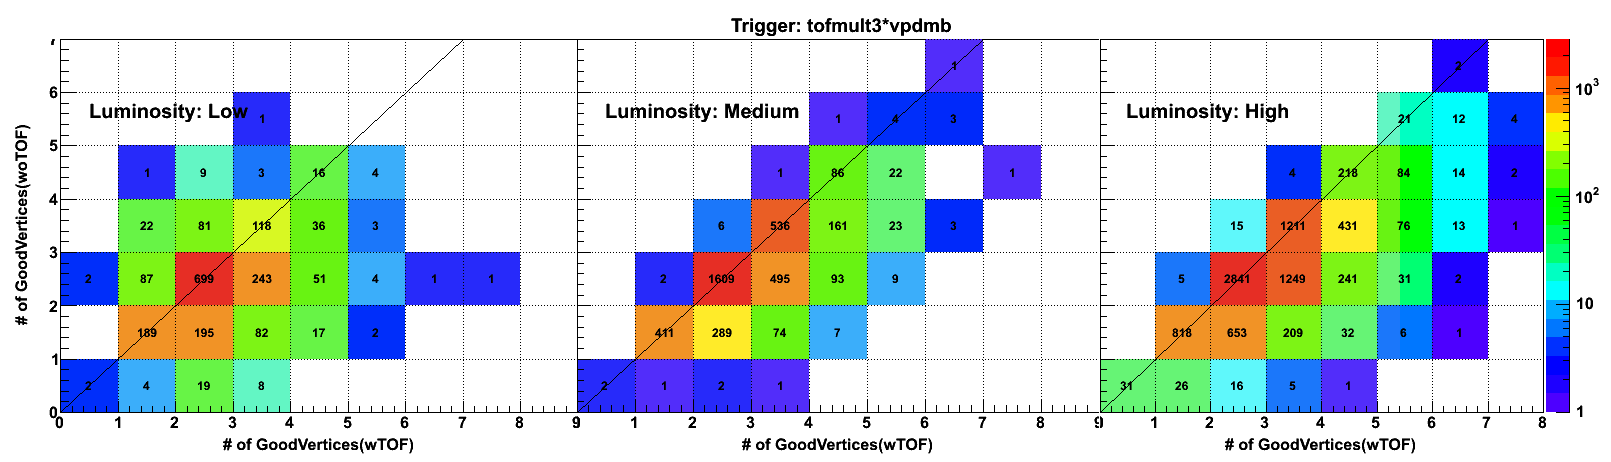
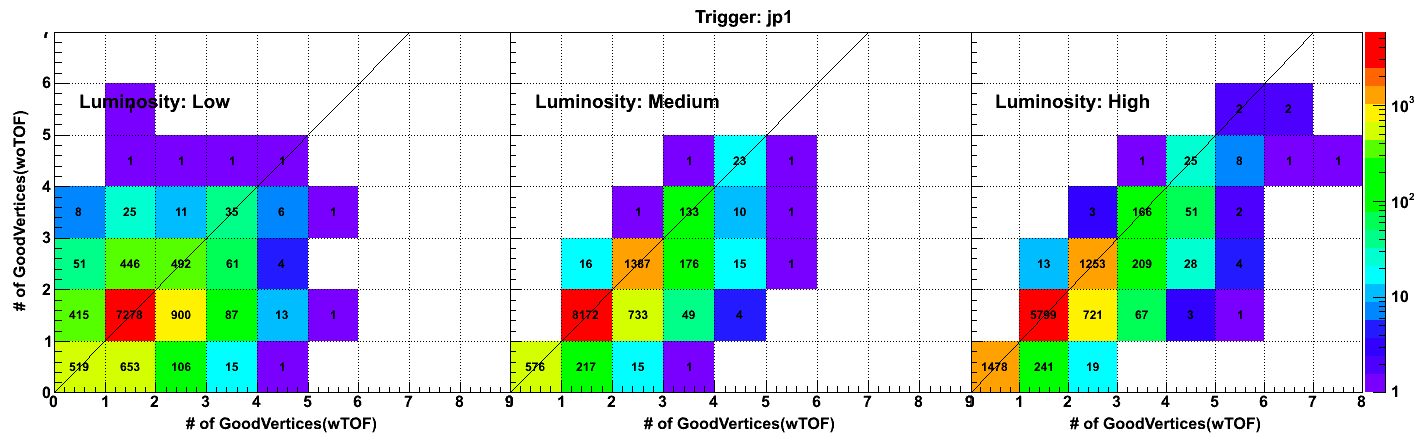
Fig. 4: The ranking distributions for all vertices from PPV w/ and w/o TOF. Tha Maximum value is normalized to unity.
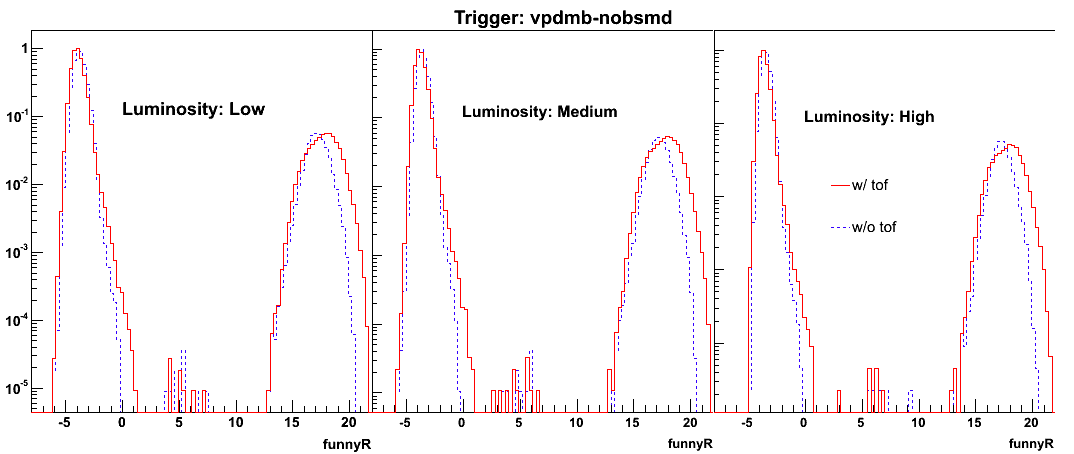
Fig. 5: Vz correlation for the good vertex (ranking>0) with the highest ranking in each event for PPV w/ and w/o.
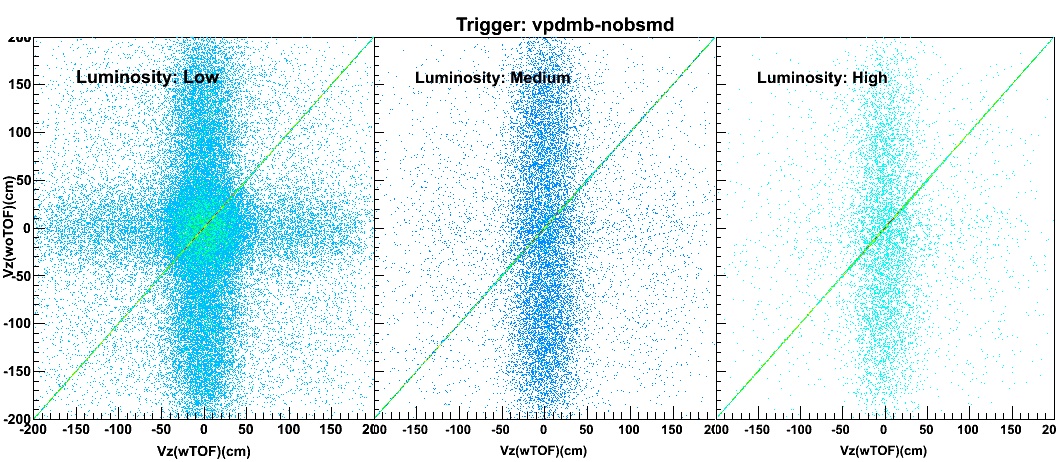
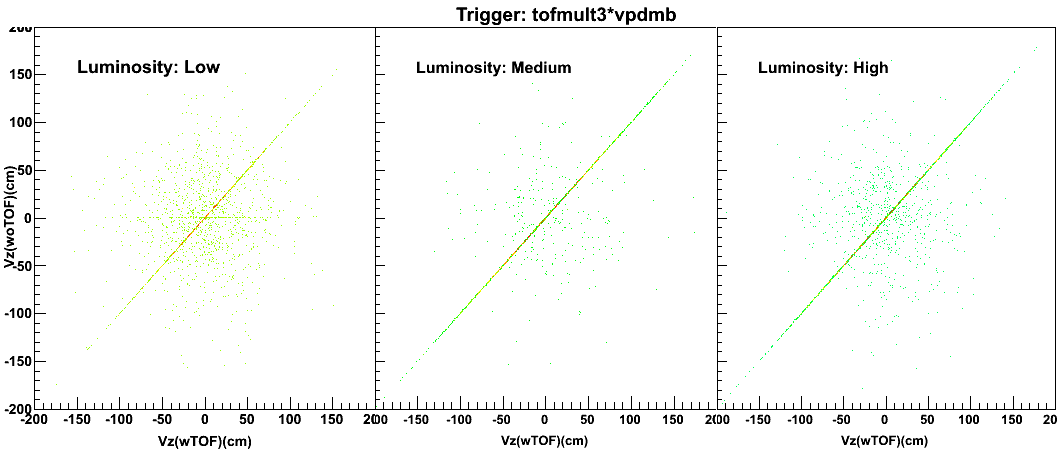
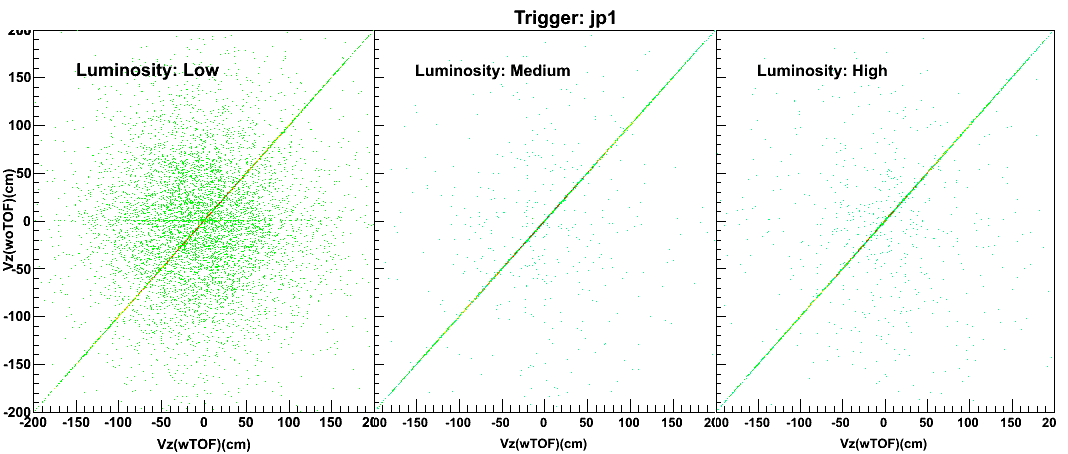
Fig. 6: Vz difference between vertices found in PPV w/ TOF and w/o TOF for the first good vertex in each event if any.
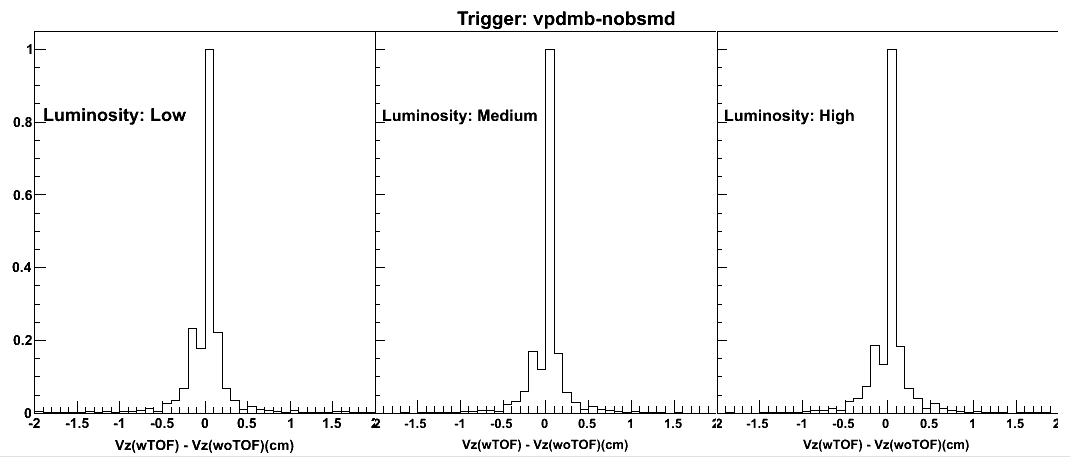
Fig. 7: The first good vefrtex Vz and VpdVz difference in w/ and w/o TOF scenarios.
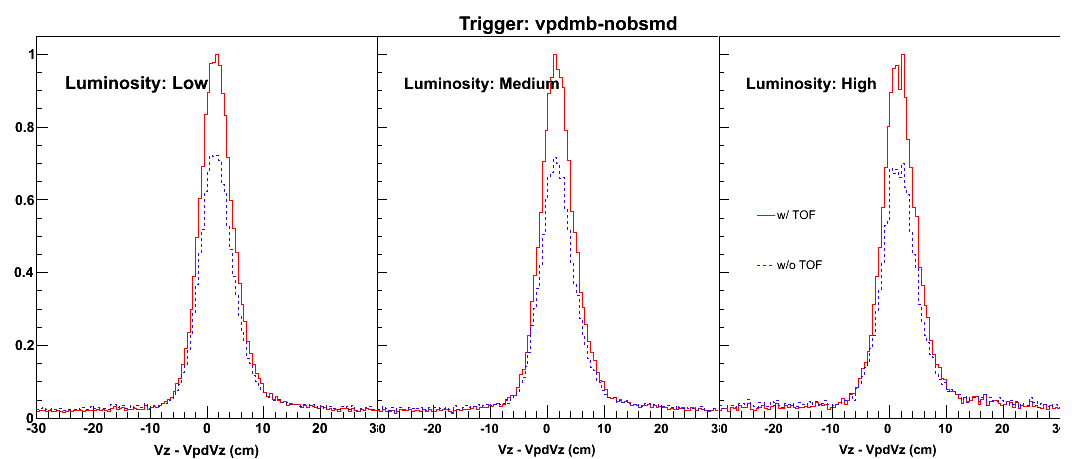
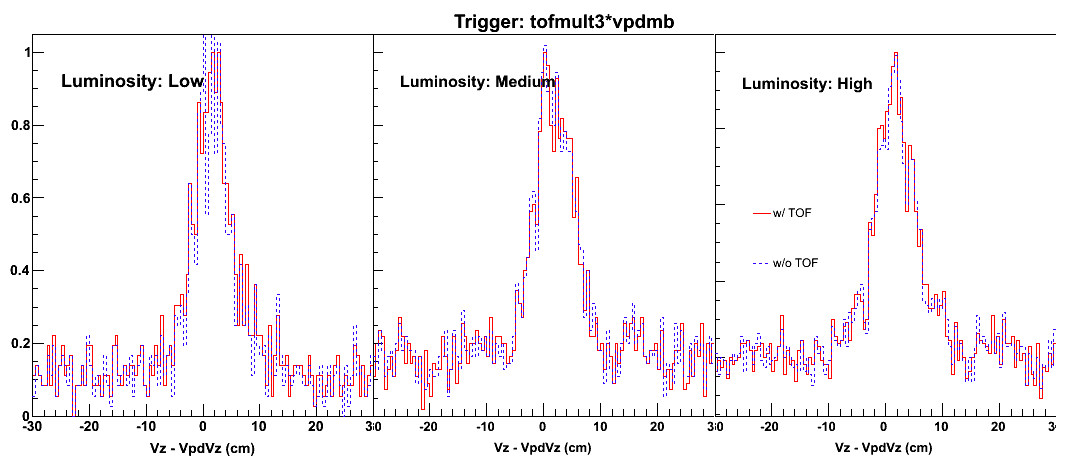
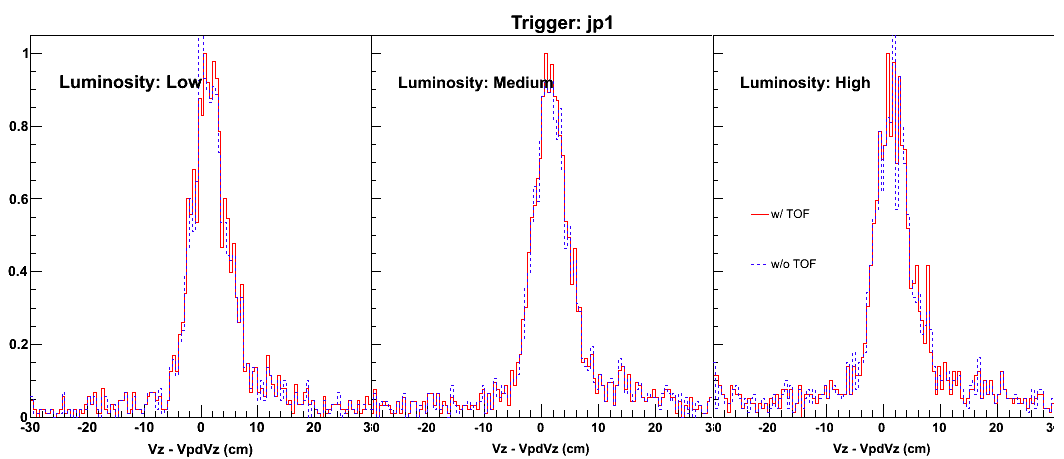
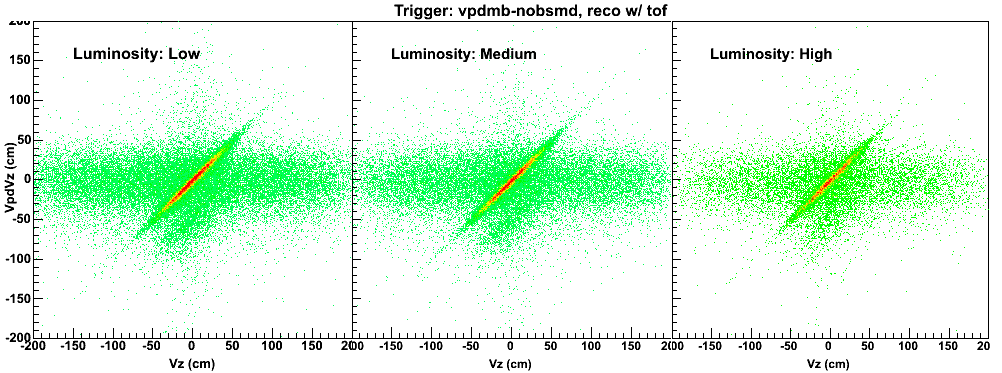
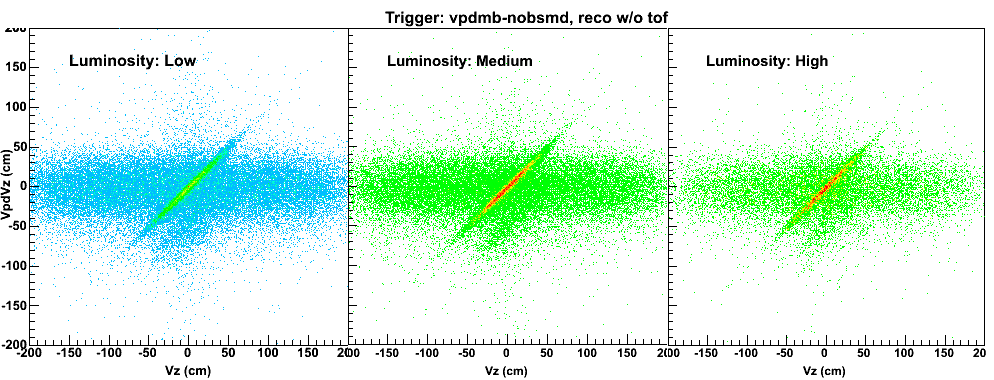
Fig.8: The first good vertex Vz and VpdVz 2D correlation for PPV w/ TOF
- yyang's blog
- Login or register to post comments