MC study on PPV with BTOF in Run 12 geometry
This is a follow up of the previous study of ppv w/o pile-up effect, from where the pythia setup can be found.
In this study, the simulation were done at several pileup levels, the pileup simulation procedure is documented in Jan Balewski's web page.
The following set up was used in this study.
mode BTOF back 1; mode TPCE back 3761376; gback 470 470 0.15 106. 1.5; rndm 10 1200
Here shows the results,
Fig. 1: Vertex efficiencies at different pileup levels for cases of w/ BTOF and w/o BTOF.
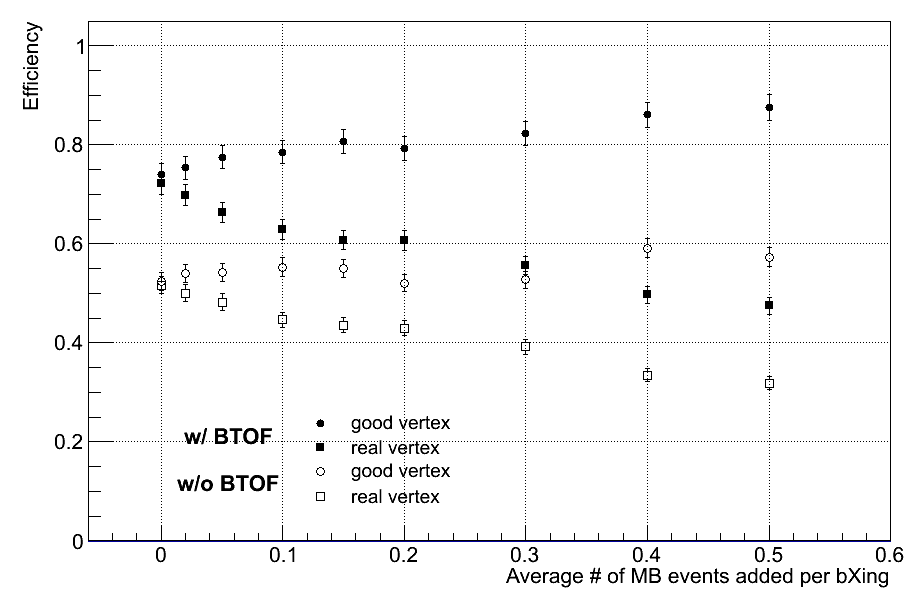
Here: good vertex is definited as vertex with positiving ranking. real vertex is definited as good vertex && |Vz-Vz_MC|<1 cm.
Fig. 2: Vertex ranking distributions at each pileup level for both w/ and w/o BTOF cases.
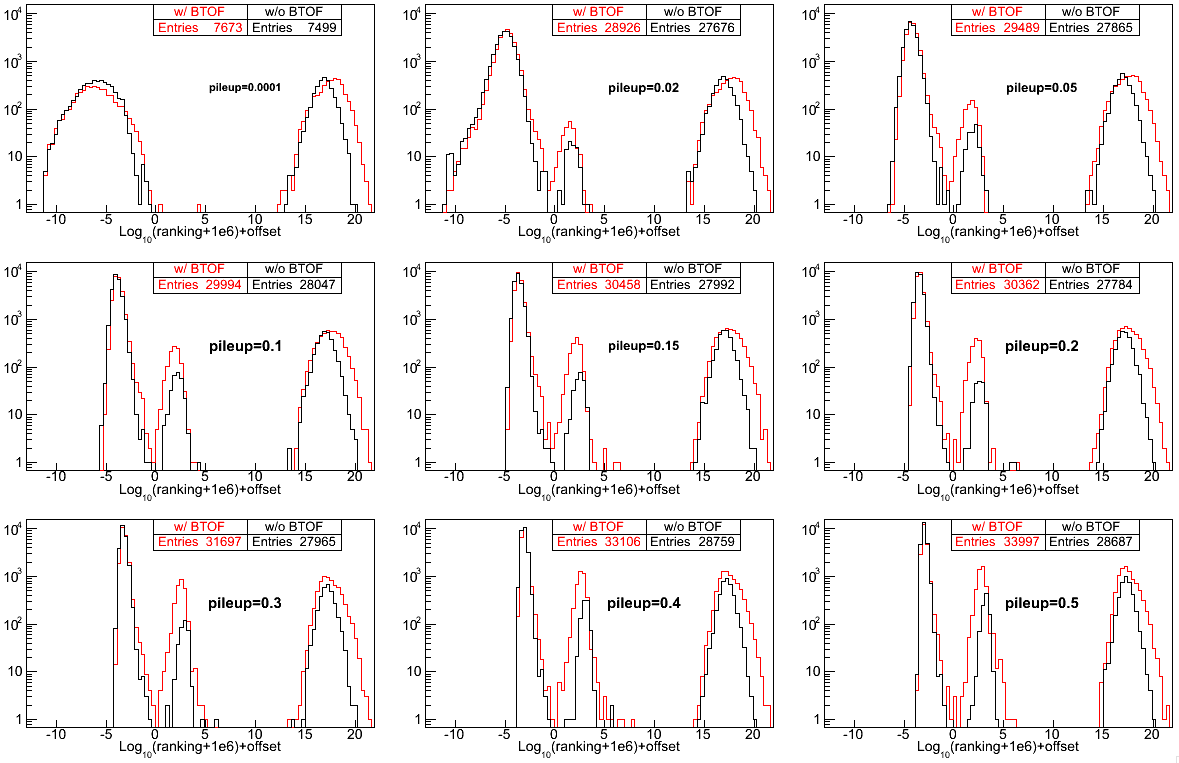
Fig. 3: Vertex z difference (Vzrec - VzMC) distributions in different pileup levels for both w/ and w/o BTOF cases. Two plots in each row in each plot are the same distribution, but shown in two different ranges.
| pileup = 0.0001 | pileup = 0.02 | pileup = 0.05 | |
|
w/o BTOF |
 |
 |
 |
|
w/ BTOF |
 |
 |
 |
| pileup = 0.10 | pileup = 0.15 | pileup = 0.20 | |
| w/o BTOF |  |
 |
 |
|
w/ BTOF |
 |
 |
 |
| pileup = 0.30 | pileup = 0.40 | pileup = 0.50 | |
|
w/o BTOF |
 |
 |
 |
|
w/ BTOF |
 |
 |
 |
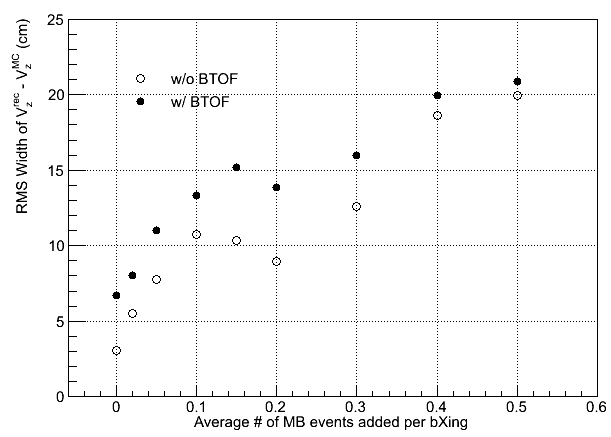
To quantify these distributions, I use the following two variables: Gaussian width of the main peak around 0 and the RMS of the whole distribution. Fig. 4 and 5 show the distributions of these two:
Fig. 4: Peak width of Vzrec-VzMC in Fig. 3 (first good) in different pileup levels.
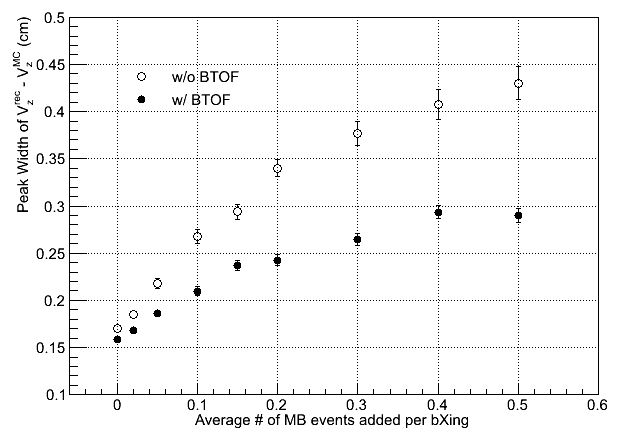
Fig. 5: RMS of Vzrec-VzMC distributions in different pileup levels.
- yyang's blog
- Login or register to post comments