- zchang's home page
- Posts
- 2023
- October (1)
- 2022
- 2021
- 2020
- 2019
- December (1)
- November (2)
- October (1)
- September (2)
- August (2)
- June (2)
- May (2)
- April (2)
- March (2)
- January (1)
- 2018
- 2017
- 2016
- December (1)
- October (4)
- September (1)
- August (3)
- July (1)
- June (2)
- May (4)
- April (1)
- March (4)
- February (1)
- 2015
- December (1)
- November (1)
- October (3)
- September (4)
- August (3)
- July (2)
- May (1)
- March (1)
- February (1)
- 2014
- December (2)
- November (1)
- October (1)
- September (8)
- August (2)
- July (1)
- June (1)
- May (2)
- April (1)
- March (1)
- February (1)
- January (1)
- 2013
- 2012
- My blog
- Post new blog entry
- All blogs
Run12 Inclusive Jet A_LL -- summary
Updated on Wed, 2018-02-07 00:34. Originally created by zchang on 2016-10-30 18:19.
Appendix:
The following figure shows the run12 final results compared with the run12 preliminary results (green box). Note: the run12 preliminary systematic includes the A_LL shift from detector jets to parton jets, in contrast to the final run12 results, this is applied as a absolute correction on the measured jet A_LL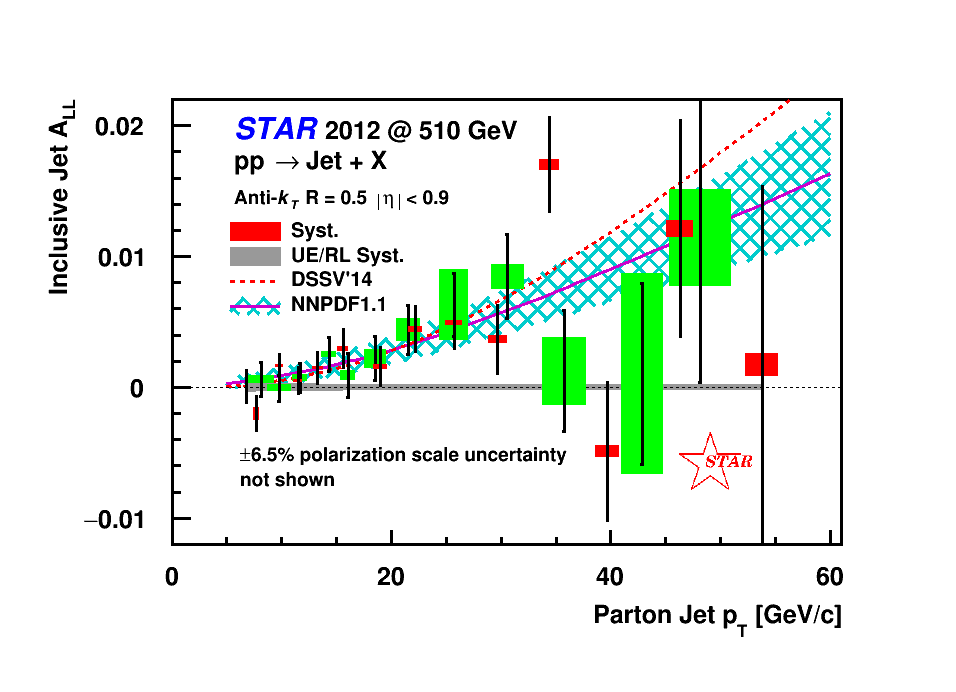 .
.
 '
'
-----Updates 12/20/16------
For Figure 1 to 5, points are for data and histograms are for simulation (embedding).
Figure 1: jet spectrum divided by triggers, ratio = (data-simu)/data.
.png)
Figure 2: charged hadron jT.
.png)
Figure 3: charged hadron z.
.png)
Figure 4: jet NEF.
.png)
Figure 5: underlying event charged pT distribution.
.png)
Figure 6 (new): sampled xg distribution will aLL weighting, points: triggered detector jets vs. histograms: all parton jets (minbias).
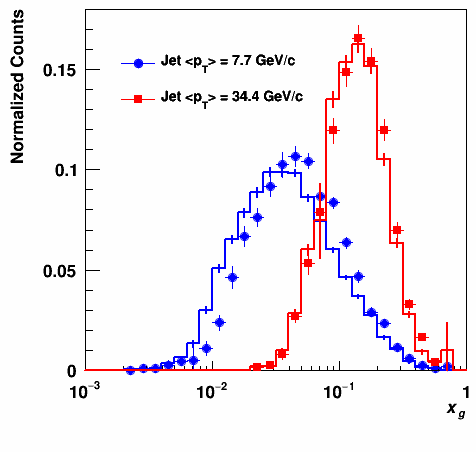
Figure 6 (old): sampled xg distribution, points: triggered detector jets vs. histograms: all parton jets (minbias).
.png)
------End Updates 12/20/16------
Proposed figures for journal publications, PRD or PLB. If submitting to PLB, we may consider only use the Figures 1 to 8. Otherwise, we could possibly use all of them. These figures are the proposed version, subject to further modifications.
Figure 1: jet spectrum comparison, data: blue simulation red.
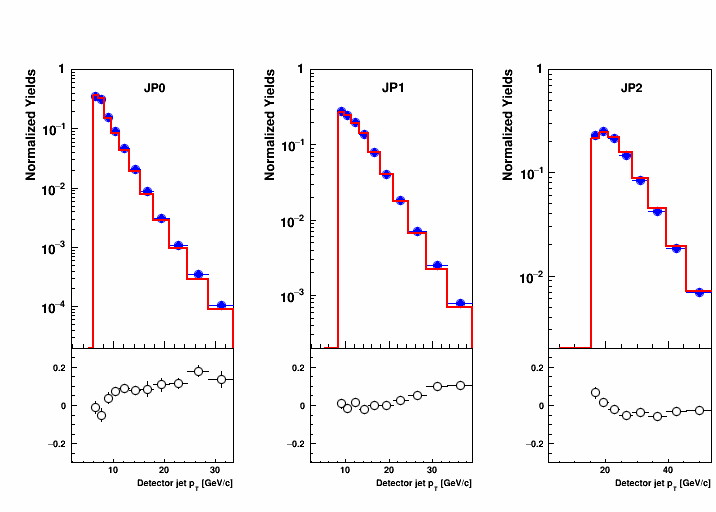
Figure 2: jet jT distribution, data: blue simulation red.
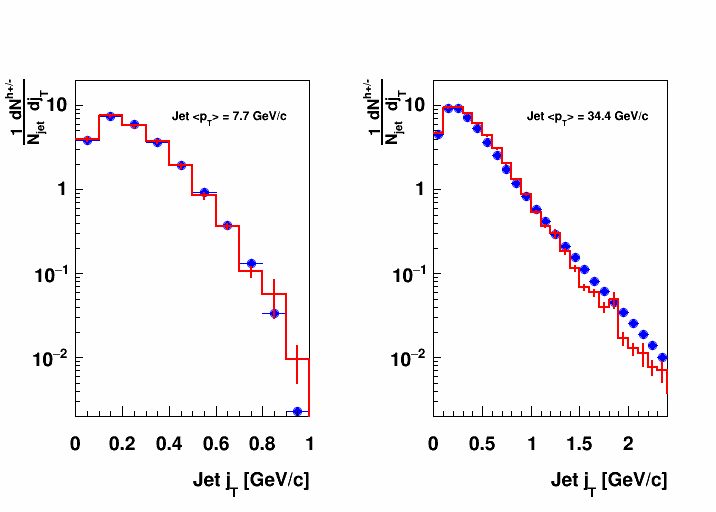
Figure 3: jet z distribution, data: blue simulation red.
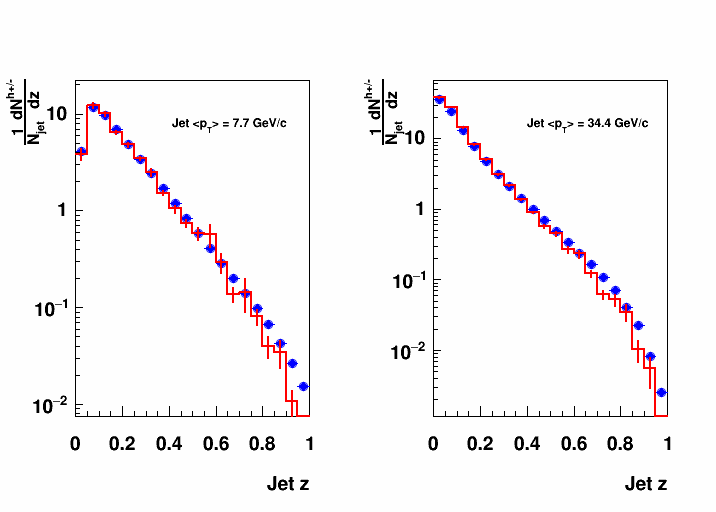
Figure 4: underlying event dpT asymmetry with a constant fit.
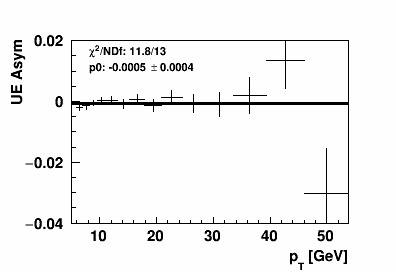
Figure 5: sample xg distributions, blue: sample by the detector jet pT, red: sampled by the shifted parton jet pT relative to the detector jet pT, green:sampled by the parton jet pT with the same range as the detector jet pT.
.png)
Figure 6: run12 inclusive jet ALL vs. parton jet pT.
.png)
Figure 7: run12 inclusive jet ALL with run9 inclusive jet ALL vs. xT.
.png)
Figure 8: run12 inclusive jet ALL with predictions from 100 NNPDF pol1.1 replica.
.png)
Figure 9: jet NEF distribution, data: blue simulation red.
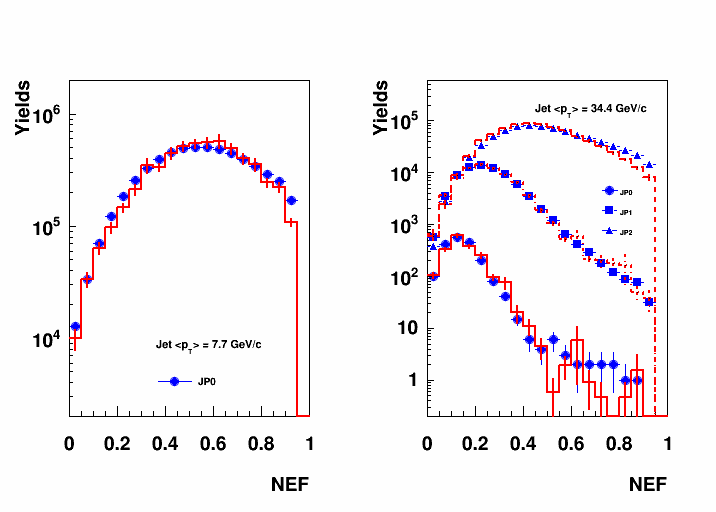
Figure 10: underlying event dpT vs underlying event corrected detector jet pT, data: blue simulation red.
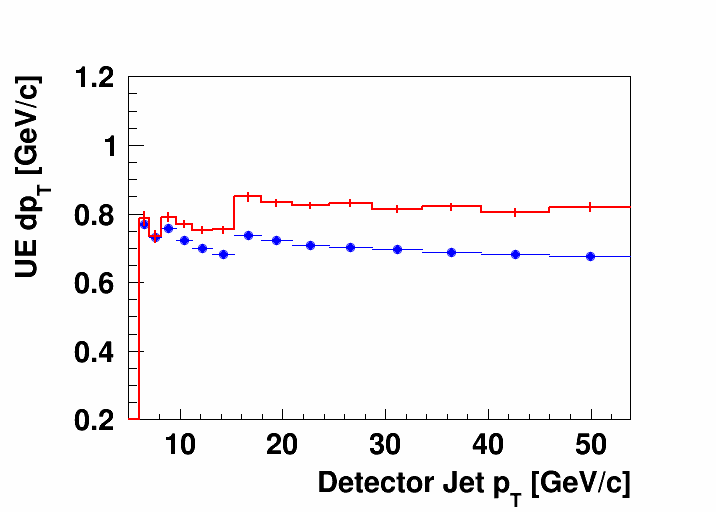
Figure 11: underlying event track (left) and tower (right) distributions, data: blue simulation red.
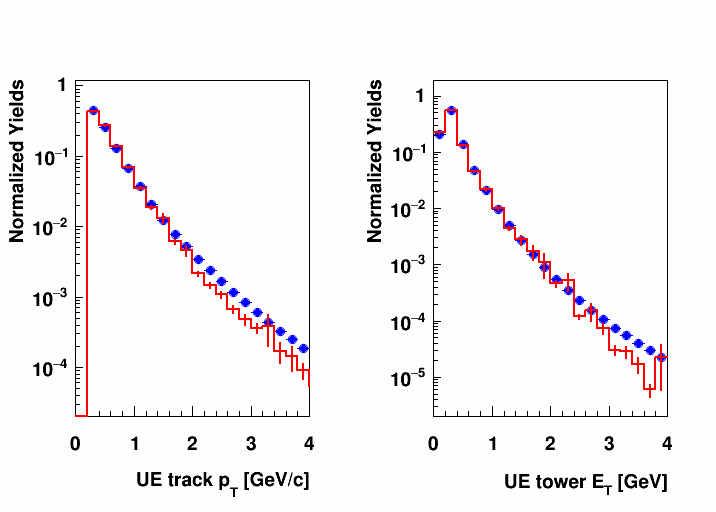
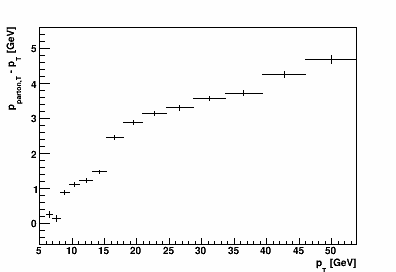
Figure 12: the detector to parton jet pT shift vs. the detector jet pT.
»
- zchang's blog
- Login or register to post comments