First Iteration Results
Started runing the script bigSectLoop.sh yesterday for all the runs. It was able to get through sections 1-9 within 8 hours. I had to finish running it through the last three sections this morning, but it got done. It produced histograms with much better counts, gains, and errors. Here is an example histogram from Section 1:
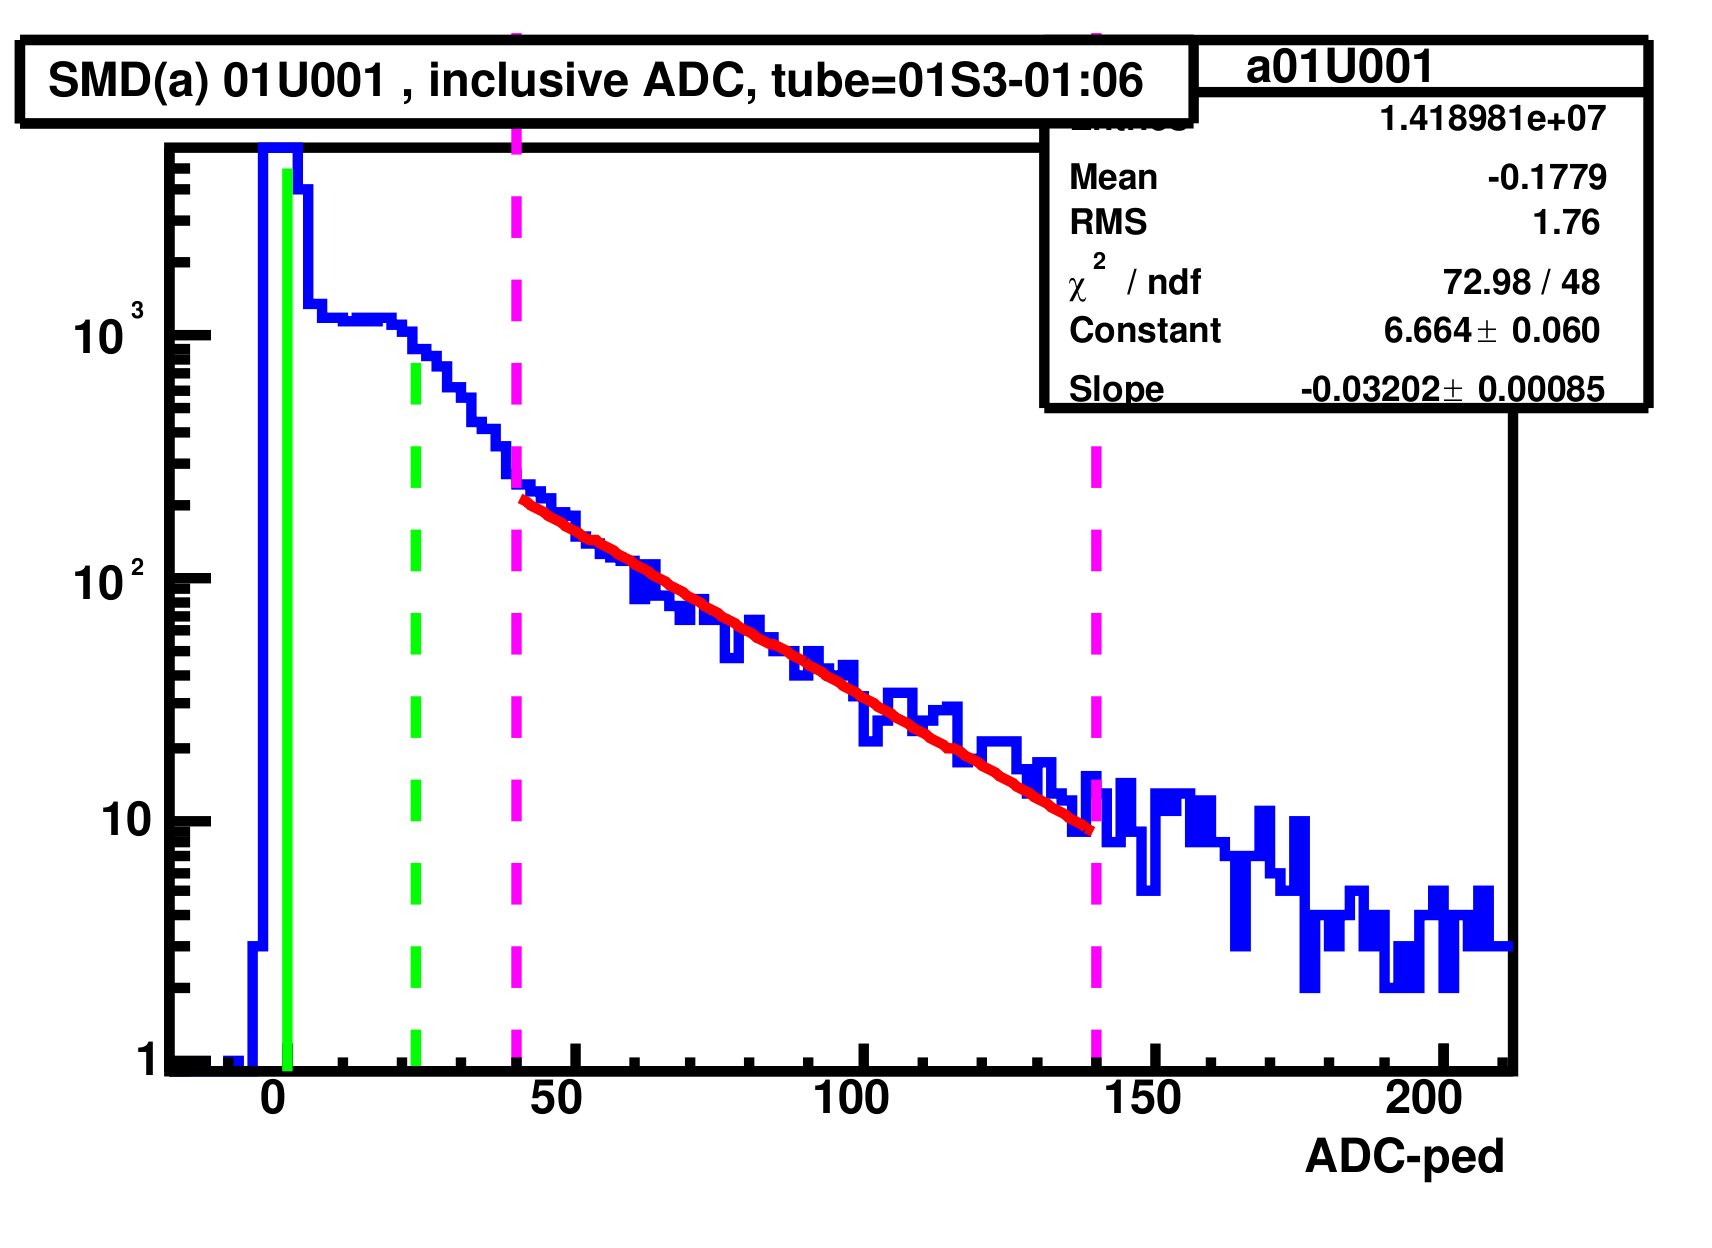
The data files also provided much better gain values now that all the runs have been included. These files a long with the .pdf files and .hist.root files are here on the star network:
/star/u/znault/aliceFiles/2010-may-18/EEMC_cal/iter-0/
Then, using Scott's 2006 EEMC Gain Calibration with mips paper (Here) as a bench mark we created these two plots for comparison:
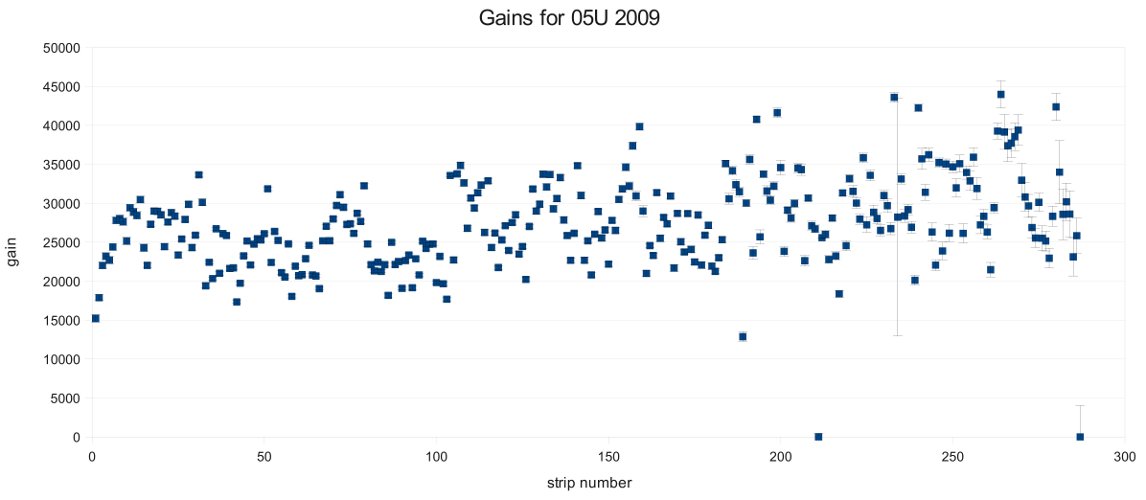
The one above is all the gains for section 5U. This is the one from Scott's paper for comparison:
The one below is the gain ration between 2009 gains and 2006 gains.
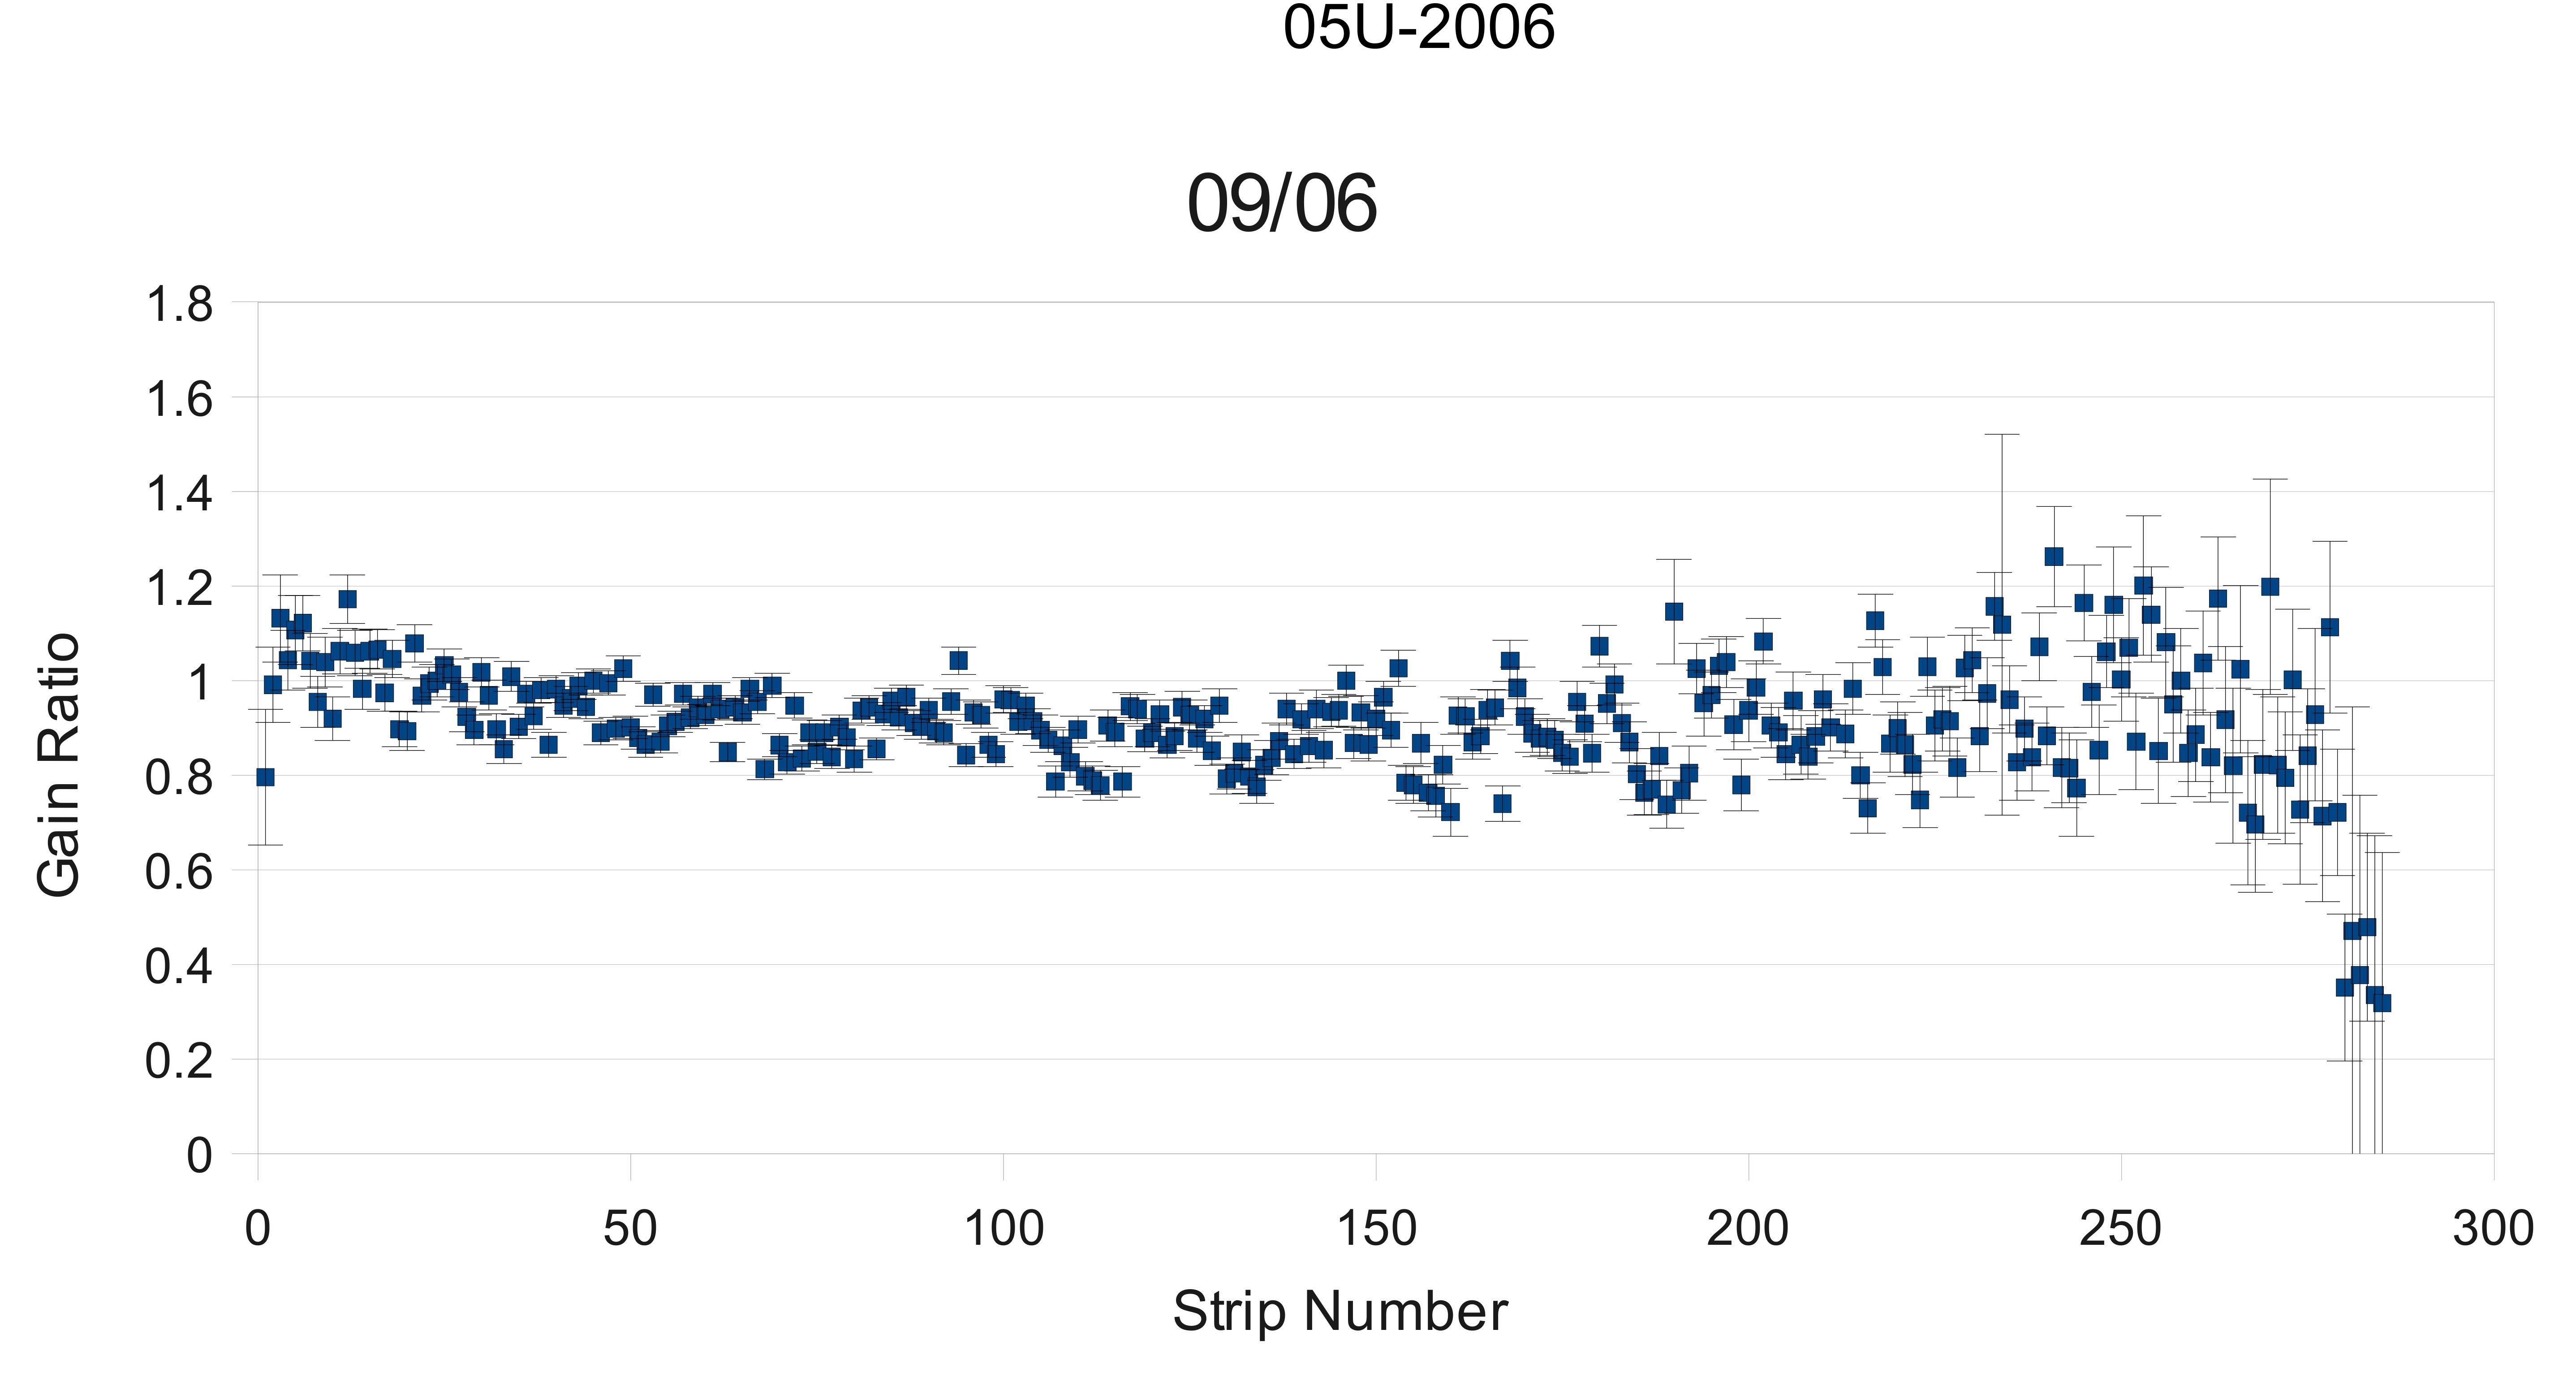
This is the one from Scott's paper for comparison:
We then attempted to do do some of the gain fits to the histograms ourselves to double check that the program was giving us correct values. We soon realized that the connection between the slope of the fit and the gain is not a direct one.
Question: Does anyone know what the relationship is between the gain and the slope? We could find no documentation on what equation is used.
- znault's blog
- Login or register to post comments