Smd Iteration Results
Using the first step in the EEMC calibration, fitting the slopes of the smd, we have recived our first results. This first iteration was done using all the runs and with no previous input of gains or masking data. Below we have some histograms showing that we are getting good statistics and that they look reasonable. Also we have plotted the gains per strip of each section/plane. Then, using the 2006 calibration data we created gain ratio plots to compare how it has changed between the two years. All of the histogram, data files, gain charts, and gain ratio charts are attached as files.
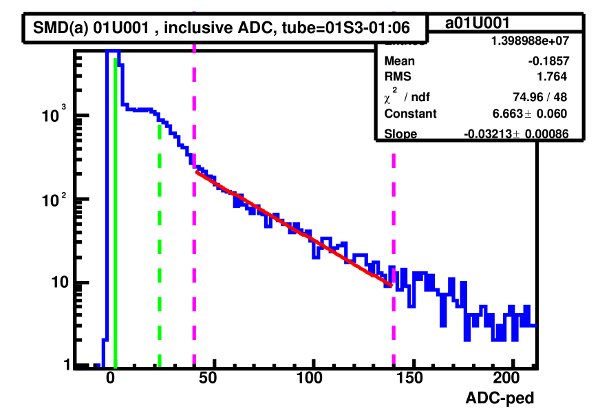
The above histogram comes from Section 01 in the U plane, strip 001. It is a semi-log plot with the fit to the slope done over the ADC range 40-140. This plot has the the ped removed. These Histograms are the combination of all the avalible runs that are listed in the atteached .xml file.
These histograms give us the slope of the fit done, but we need the relative gains. Do do this we use the inverse slope times a scale factor. This scale factor is hardcoded in and was found to be (850/1.4) ~ 607.14.
.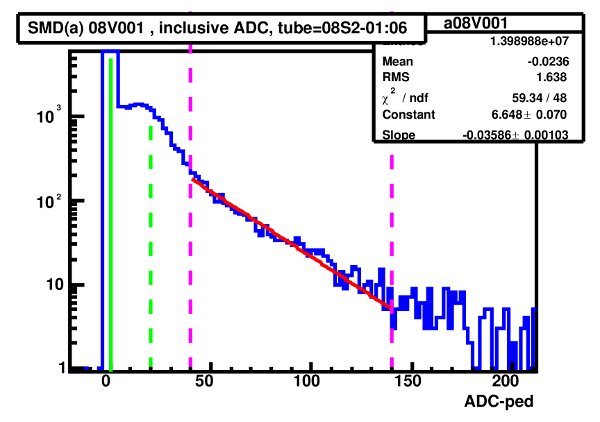
The above histogram comes from Section 08 in the V plane, strip 001. It is a semi-log plot with the fit to the slope done over the ADC range 40-140. This plot has the the ped removed.
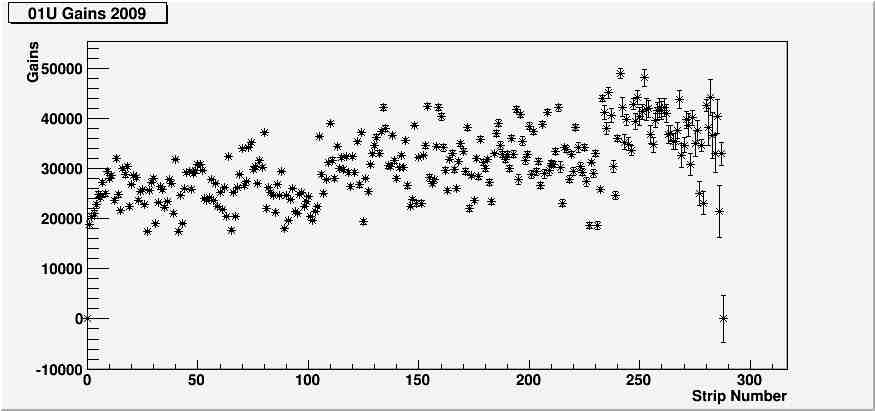
Above is a plot of all the gains in section 01U. This plot includes all the 'bad' strips so you see some with zero gain.
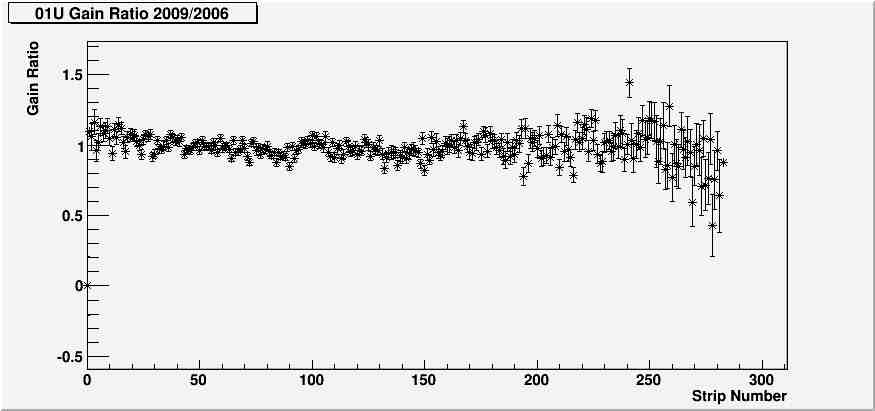
Above is the gain ratios between 2009 and 2006. All strips that had zero gain, zero error, or the error was over 50% of the value where removed so the range on the plot would be keep within reason.
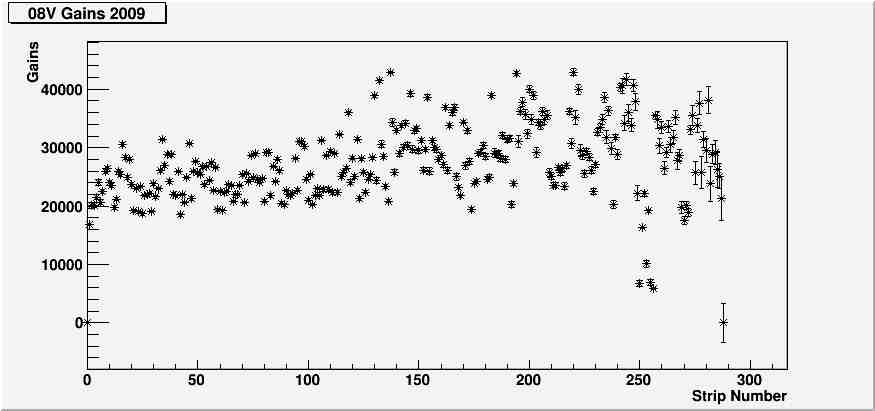
Above, same as the gain plot for section 01U, but now for section 08V
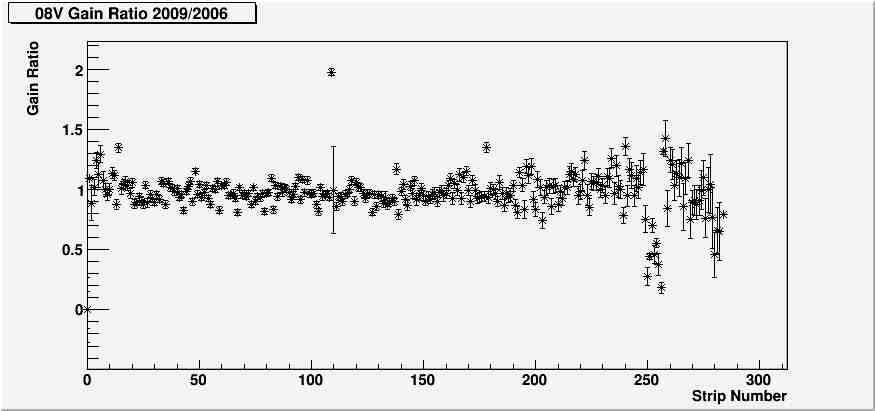
Above, same as the ratio plot for 01U, now for 08V.
once again all the plots and data files are attached below:
allRunsGainPlots.zip has all the gain vs strip plots for each section and all the gain ratio vs strip plots
allRunsDAT.zip has all the .dat files that the code outputs after it has ran. These files have all the gain and gain error information
allRunsPDF.zip has all the histograms for each section and strip.
Also the list of all the runs used is attached in a xml document.
--The code that was used to generate the gain plots is also posted. Documantation on how it is ran can be found in the comments of createGainCharts.cpp. The file extention for the two files needs to be changed from .txt to .cpp inorder to run the code. I could only attach them as .txt files so its just a quick change.
- znault's blog
- Login or register to post comments