Update on Gain change findings
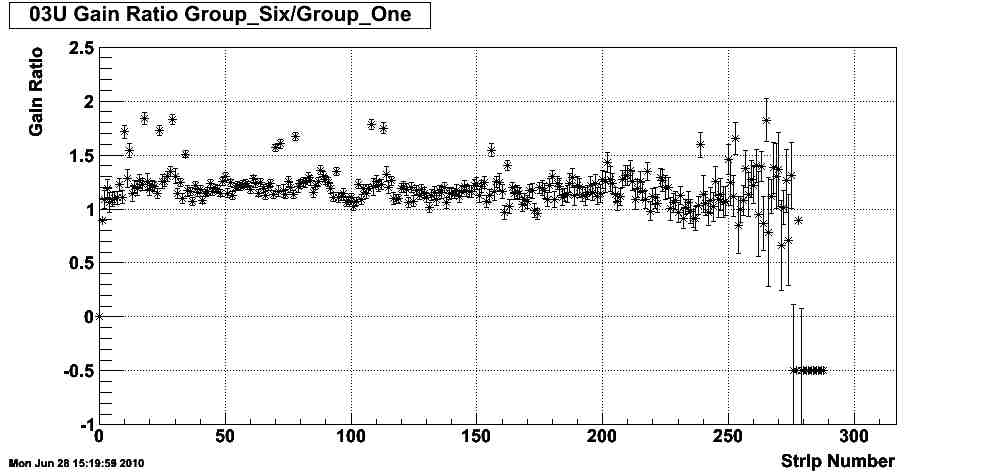
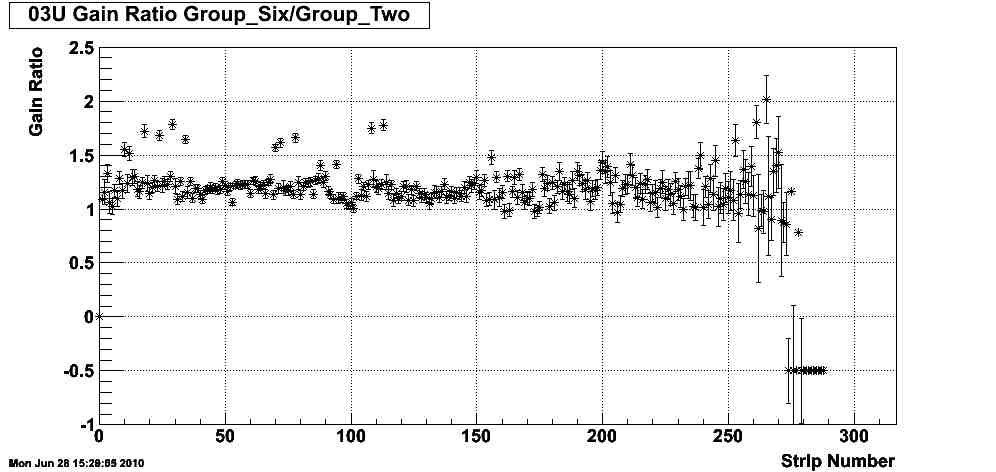
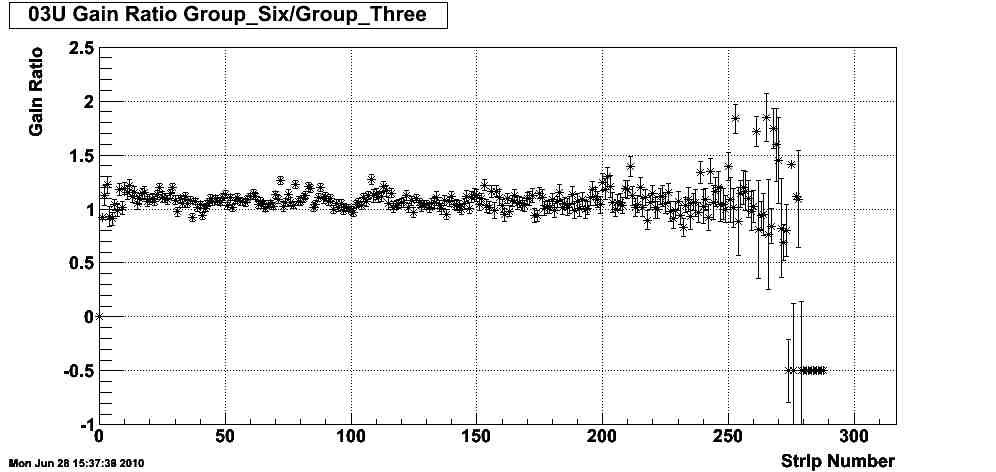
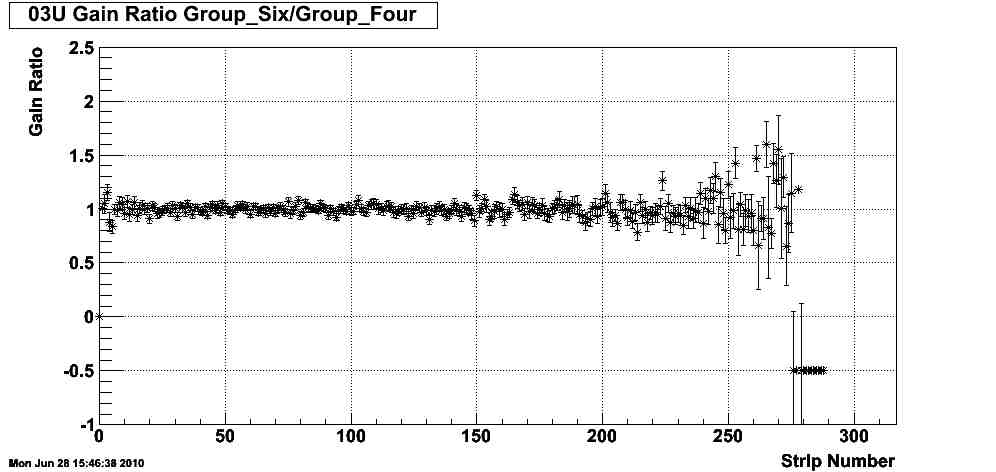
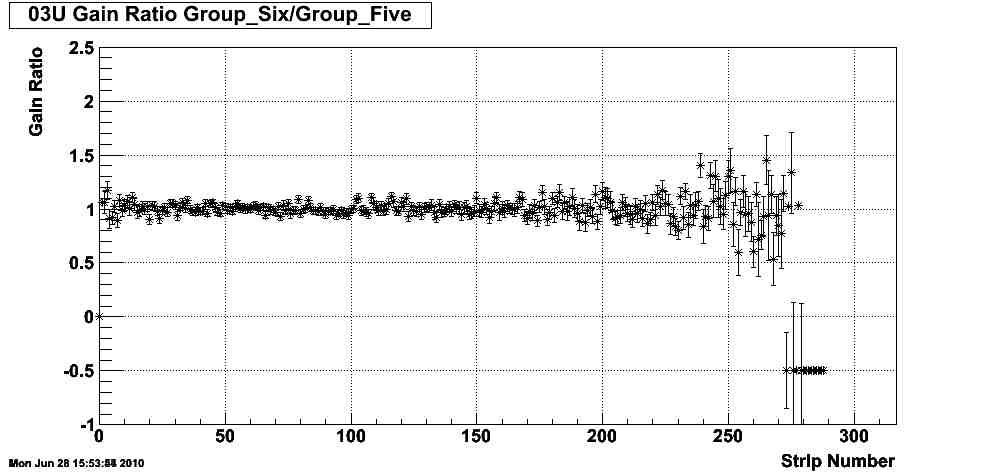
Nathaniel has been able to compare all the grouped runs and generated gain ration plots to see how they change over the whole run. These groups are noted in the excel spreadsheet attached. It was discovered that early runs where out of phase and this led to a change in the gain readings. This can be seen in the plots as you move to later and later groups. Below are gain plots comparing group six with all other groups. The points that are at -0.5 are marked as bad points because either the gain was zero or the error was zero.
Groups:
- znault's blog
- Login or register to post comments