Fms moniter status
Goal: provide infomation of curing effect for UVLED
Link: https://online.star.bnl.gov/fmsTrg/fmsled2017/ day18027 has data
what it does
1 for a certain time , scan for if there is a new run containing LED event, if it is worth to analyze(length , end time etc...)
2 if it does ,get ADC for all channels
3 normalize by a base run then , draw ADC histrry plot
what it shows
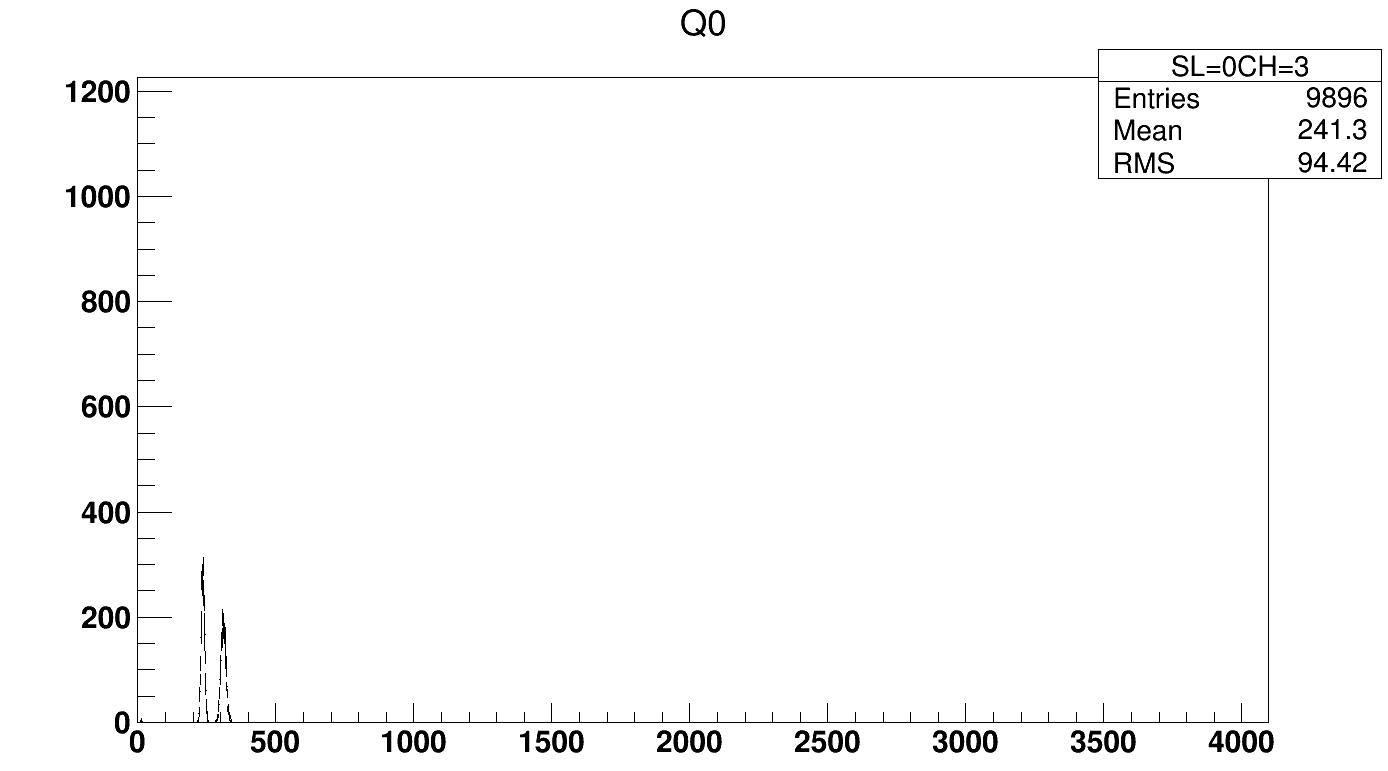
1 2-d ADC plot for each run
3 4 history plot of ADC vs time for each channel in the same QT board (1408 channel in total)
what file is kept
1 root & png file: 2-D plot of ADC distribution vs channel
2 root file: projection for each channel of the upper plot (too many .pngs ,1408 channel)
current problem of ADC plot
1 2 peak in ADC; suppose only one peak, using simple mean and rms , no fitting
========================================update 3-24
update checklist:
1 fix a small bug of reading only 1 slot
2 change to histogram
3 add line
4 change base run as the first available run
5 add led ev # and rate
6 get rid of irrelevant runs , only pp production 2017
7 double peak issue could be problematic, see pic. same channel from 2 runs.
8 add history plot for each day(qt1small)
c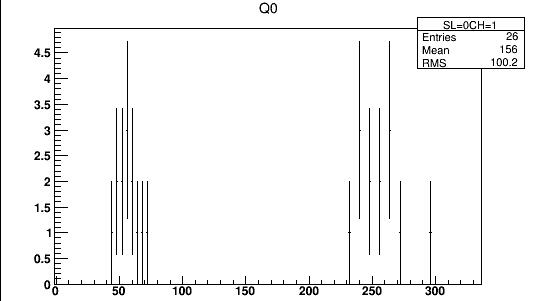
.jpg)
trgMon:
1 change scale
- zwzhu's blog
- Login or register to post comments