06 Jun
June 2008 posts
2008.06.04 Gamma cluster energy in various EEMC layers: data vs MC
Ilya Selyuzhenkov June 04, 2008
Gamma cluster energy in various EEMC layers: data vs MC
Three data sets:
- pp2006 - STAR 2006 pp longitudinal data (~ 3.164 pb^1) after applying gamma-jet isolation cuts.
- gamma-jet - data-driven Pythia gamma-jet sample (~170K events). Partonic pt range 5-35 GeV.
- QCD jets - data-driven Pythia QCD jets sample (~4M events). Partonic pt range 3-65 GeV.
Figure 1: Gamma candidate EEMC pre-shower 1 energy (3x3 cluster).
pt cuts of 7GeV for the gamma and of 5 GeV for the away side jet have been applied.
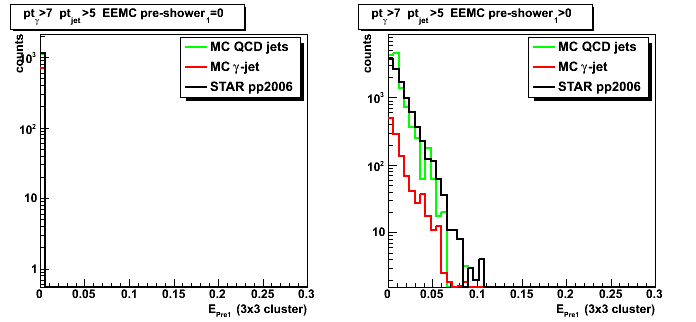
Figure 2: Gamma candidate EEMC pre-shower 2 energy (3x3 cluster).
pt cuts of 7GeV for the gamma and of 5 GeV for the away side jet have been applied.
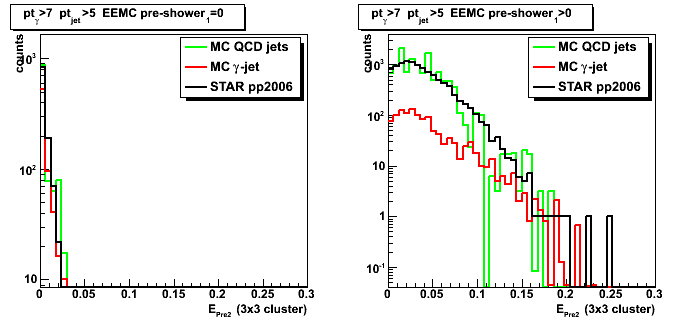
Figure 3: Gamma candidate EEMC tower energy (3x3 cluster).
pt cuts of 7GeV for the gamma and of 5 GeV for the away side jet have been applied.
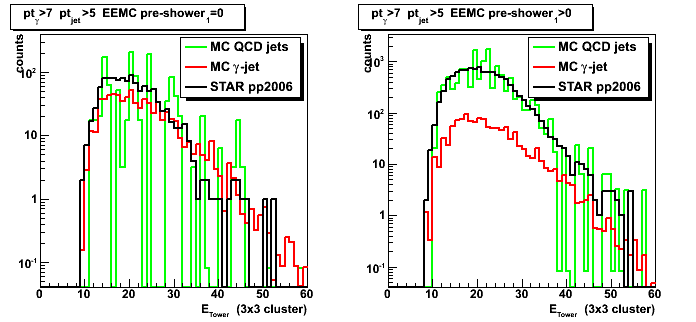
Figure 4: Gamma candidate EEMC post-shower energy (3x3 cluster).
pt cuts of 7GeV for the gamma and of 5 GeV for the away side jet have been applied.
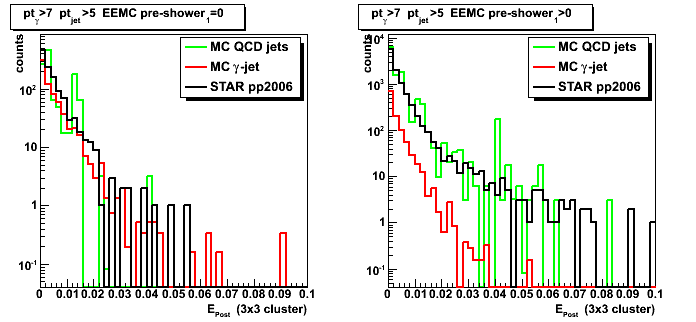
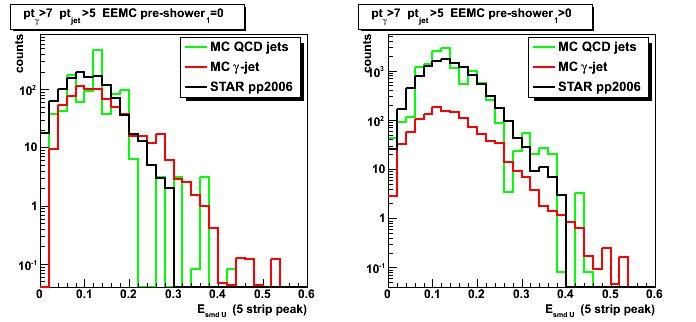
Figure 5: Gamma candidate EEMC SMD u-plane energy [5-strip cluster] (Figure for v-plane)
pt cuts of 7GeV for the gamma and of 5 GeV for the away side jet have been applied.
Difference between total and gamma candidate cluster energy for various EEMC layers
Figure 6: Total minus gamma candidate (3x3 cluster) energy in EEMC pre-shower 1 layer
pt cuts of 7GeV for the gamma and of 5 GeV for the away side jet have been applied.
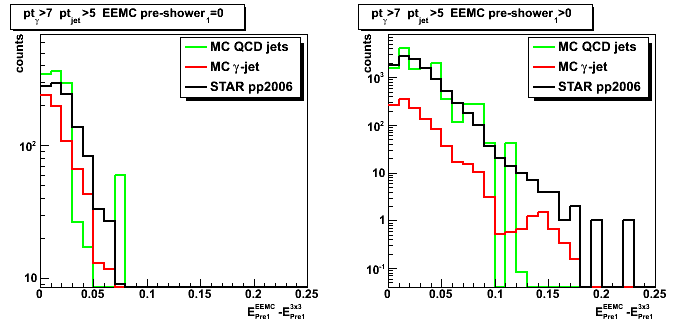
Figure 7: Total minus gamma candidate (3x3 cluster) energy in EEMC pre-shower 2 layer
pt cuts of 7GeV for the gamma and of 5 GeV for the away side jet have been applied.
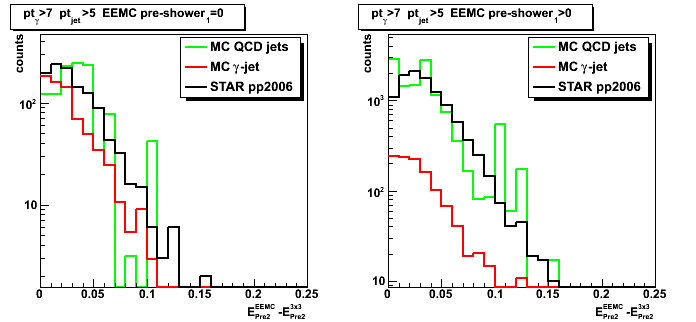
Figure 8: Total minus gamma candidate (3x3 cluster) energy in EEMC tower
pt cuts of 7GeV for the gamma and of 5 GeV for the away side jet have been applied.
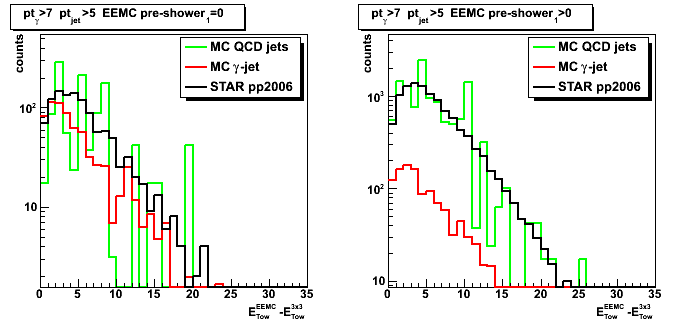
Figure 9: Total minus gamma candidate (3x3 cluster) energy in EEMC post-shower layer
pt cuts of 7GeV for the gamma and of 5 GeV for the away side jet have been applied.
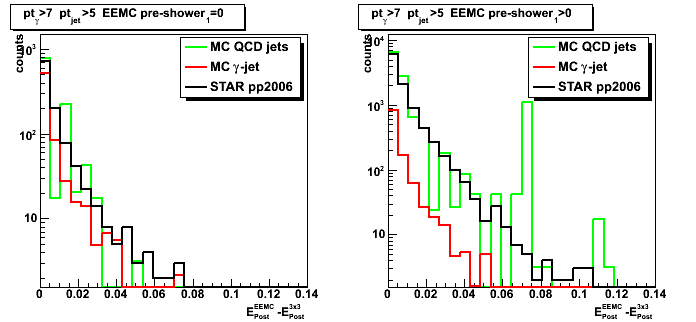
Figure 10: Total (sector) energy minus gamma candidate (5-strip cluster) energy in EEMC SMD[u-v] layer
pt cuts of 7GeV for the gamma and of 5 GeV for the away side jet have been applied.
2008.06.09 STAR White paper plots (pt distribution: R_cluster 0.99 and 0.9 cuts)
Ilya Selyuzhenkov June 09, 2008
Gamma pt distribution: data vs MC (R_cluster 0.99 and 0.9 cuts)
Three data sets:
- pp2006 - STAR 2006 pp longitudinal data (~ 3.164 pb^1) after applying gamma-jet isolation cuts.
- gamma-jet - data-driven Pythia gamma-jet sample (~170K events). Partonic pt range 5-35 GeV.
- QCD jets - data-driven Pythia QCD jets sample (~4M events). Partonic pt range 3-65 GeV.
Numerical values for different pt-bins from Fig. 1-2
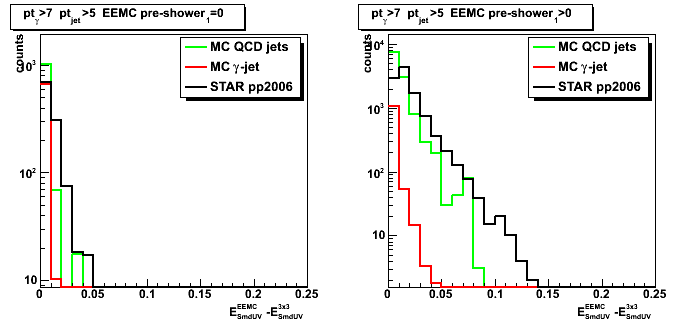
Figure 1: Gamma pt distribution for R_cluster >0.9.
No energy in both pre-shower layer (left plot), and
No energy in pre-shower1 and non-zero energy in pre-shower2 (right plot)
Same figure for R_cluster>0.99 can be found here
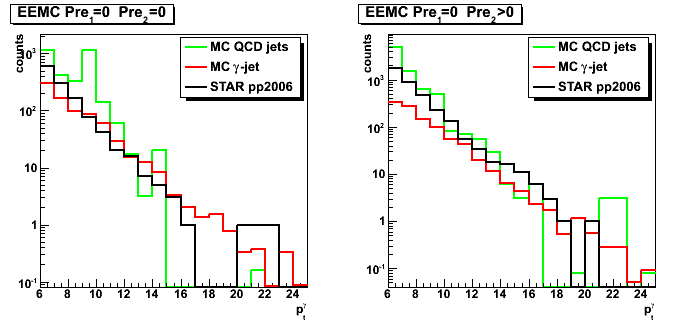
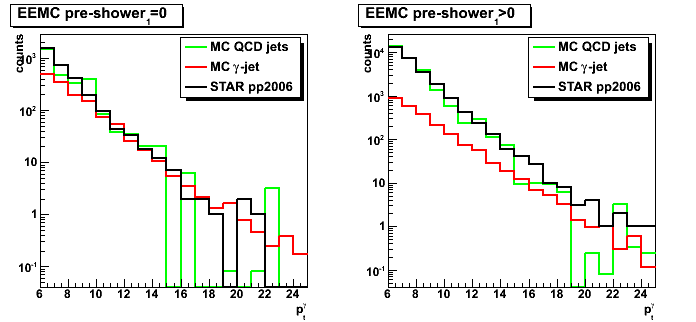
Figure 2: Gamma pt distribution for R_cluster >0.9.
No energy in first EEMC pre-shower1 layer (left plot), and
non-zero energy in pre-shower1 (right plot)
For more details (yield, ratios, all pre12 four conditions, etc) see figures 1-3 here.
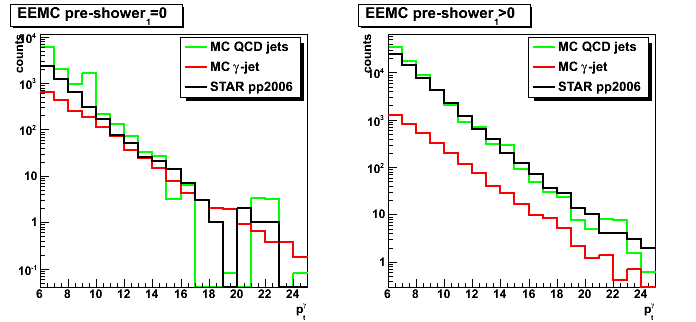
Figure 3: Gamma pt distribution for R_cluster >0.99.
For more details (yield, ratios, all pre12 four conditions, etc) see figures 1-3 here.
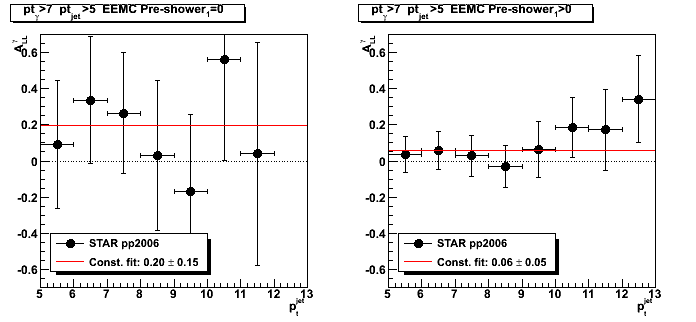
2008.06.10 Gamma-jet candidate longitudinal double spin asymmetry
Ilya Selyuzhenkov June 10, 2008
Note: No background subtraction has been done yet
The case of pre-shower1=0 (left plots) roughly has 1:1 signal to background ratio,
while pre-shower1>0 (right plots) have 1:10 ratio (See MC to data comparison for details).
Data sets:
- pp2006 - STAR 2006 pp longitudinal data (~ 3.164 pb^1) after applying gamma-jet isolation cuts,
plus two additional vertex QA cuts:
a) |z_vertex| < 100 and
b) 180 < bbcTimeBin < 300 - Polarization fill by fill: blue and yellow
- Relative luminosity by polarization fills and runs: relLumi06_070614.txt.gz
- Equations used to calculate A_LL from the data: pdf file
Figure 1: Gamma-jet candidate A_LL vs gamma pt.
Figures for related epsilon_LL and 1/Lum scaled by a factor 10^7
(see pdf/html links above for epsilon_LL and 1/Lum definitions)
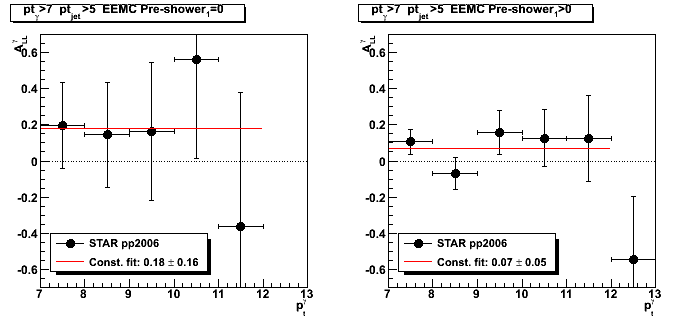
Figure 2: Gamma-jet candidate A_LL vs x_gluon.
Figures for related epsilon_LL and 1/Lum scaled by a factor 10^7
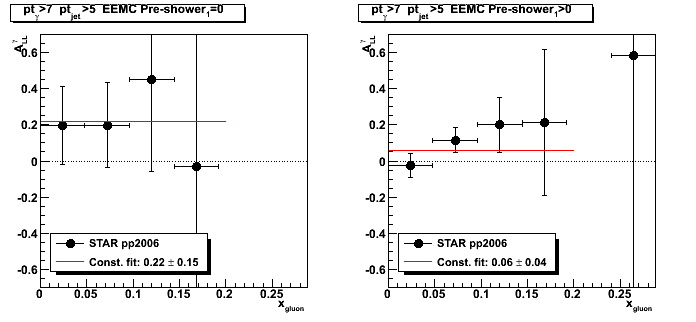
Figure 3: Gamma-jet candidate A_LL vs x_quark.
Figures for related epsilon_LL and 1/Lum scaled by a factor 10^7
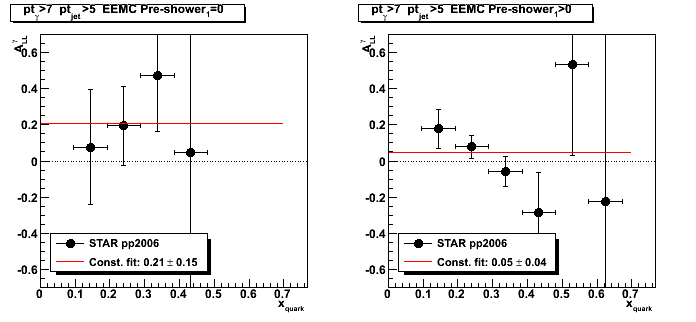
Figure 4: Gamma-jet candidate A_LL vs away side jet pt.
Figures for related epsilon_LL and 1/Lum scaled by a factor 10^7
2008.06.18 Photon-jet reconstruction with the EEMC detector (talk at the STAR Collaboration meeting)
Ilya Selyuzhenkov June 18, 2008
Slides
Photon-jet reconstruction with the EEMC detector - Part 1: pdf or odp
Talk outline (preliminary)
- Introduction and motivation
-
Data samples (pp2006, MC gJet, MC QCD bg)
and gamma-jet reconstruction algorithm: -
Comparing pp2006 with Monte-Carlo simulations scaled to the same luminosity
(EEMC pre-shower sorting): -
EEMC SMD shower shapes from different data samples
(pp2006 and data-driven Monte-Carlo): -
Sided residual plots: pp2006 vs data-driven Monte-Carlo
(gammas from eta meson: 3 gaussian fits) -
Various cuts study:
- R_cluster cut of 0.99 and 0.9 comparison
(Cluster energy distribution vs number of EEMC towers fired: Fig.4) - Charge particle veto and TPC tracking
- Away side jet pt matching
- R_cluster cut of 0.99 and 0.9 comparison
-
Some QA plots:
-
A_LL reconstruction technique:
-
Work in progress... To do list:
- Understading MC background and pp2006 data shower shapes discrepancy
- Implementing sided residual technique with shapes sorted by pre1&2 (eta, sector, etc?)
- Tuning analysis cuts
- Quantifying signal to background ratio
- Background subtraction for A_LL, ...
- What else?
- Talk summary