2008.06.09 STAR White paper plots (pt distribution: R_cluster 0.99 and 0.9 cuts)
Ilya Selyuzhenkov June 09, 2008
Gamma pt distribution: data vs MC (R_cluster 0.99 and 0.9 cuts)
Three data sets:
- pp2006 - STAR 2006 pp longitudinal data (~ 3.164 pb^1) after applying gamma-jet isolation cuts.
- gamma-jet - data-driven Pythia gamma-jet sample (~170K events). Partonic pt range 5-35 GeV.
- QCD jets - data-driven Pythia QCD jets sample (~4M events). Partonic pt range 3-65 GeV.
Numerical values for different pt-bins from Fig. 1-2
Figure 1: Gamma pt distribution for R_cluster >0.9.
No energy in both pre-shower layer (left plot), and
No energy in pre-shower1 and non-zero energy in pre-shower2 (right plot)
Same figure for R_cluster>0.99 can be found here
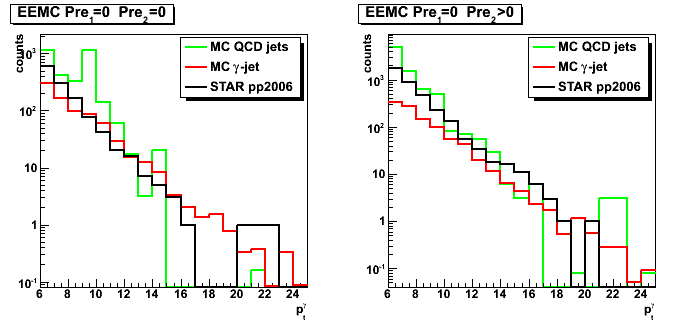
Figure 2: Gamma pt distribution for R_cluster >0.9.
No energy in first EEMC pre-shower1 layer (left plot), and
non-zero energy in pre-shower1 (right plot)
For more details (yield, ratios, all pre12 four conditions, etc) see figures 1-3 here.
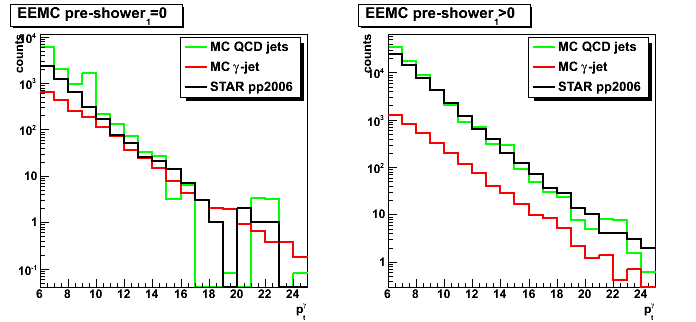
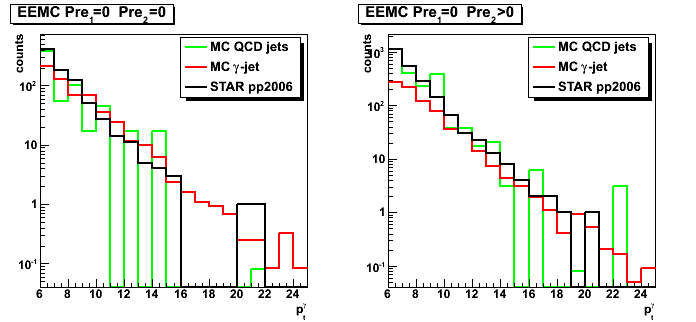
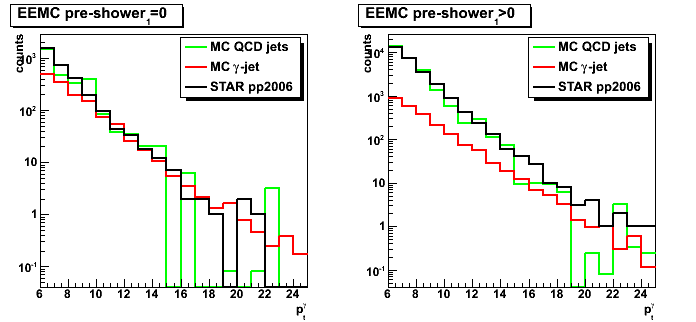
Figure 3: Gamma pt distribution for R_cluster >0.99.
For more details (yield, ratios, all pre12 four conditions, etc) see figures 1-3 here.
Groups:
- Printer-friendly version
- Login or register to post comments