Update on Sti Hit Efficiency Studies
Updated on Wed, 2015-04-22 10:54. Originally created by smirnovd on 2015-04-22 10:22.
- number of TPC hits is greater than 30
- the track is required to cross an IST active layer
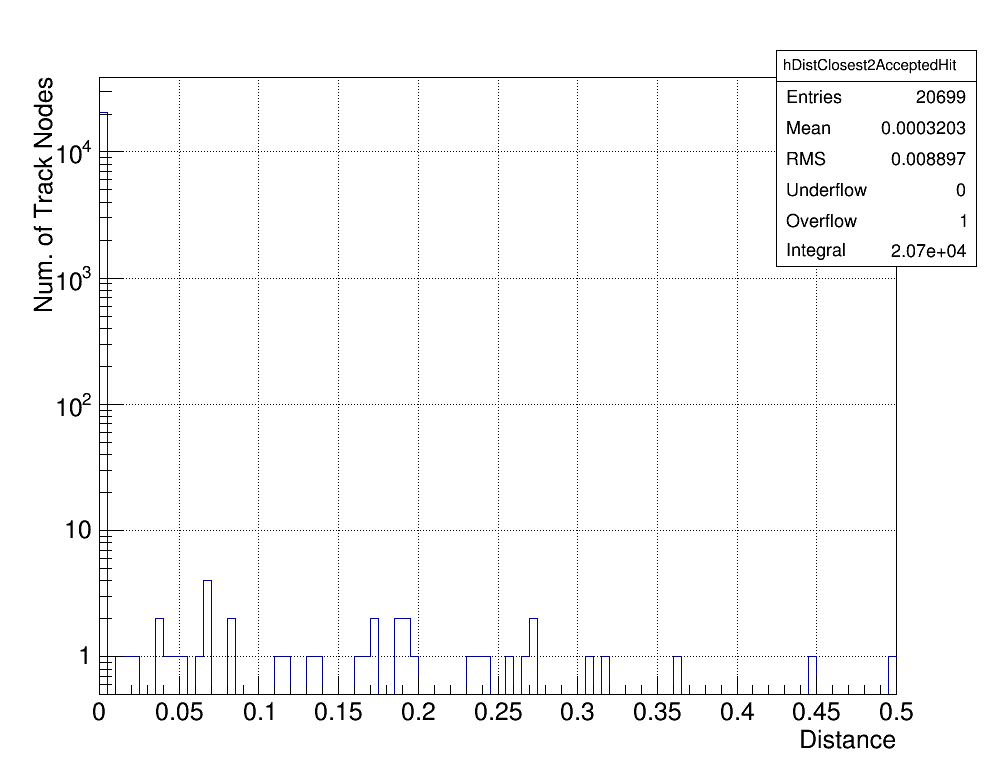
- Closest vs accepted Sti hits
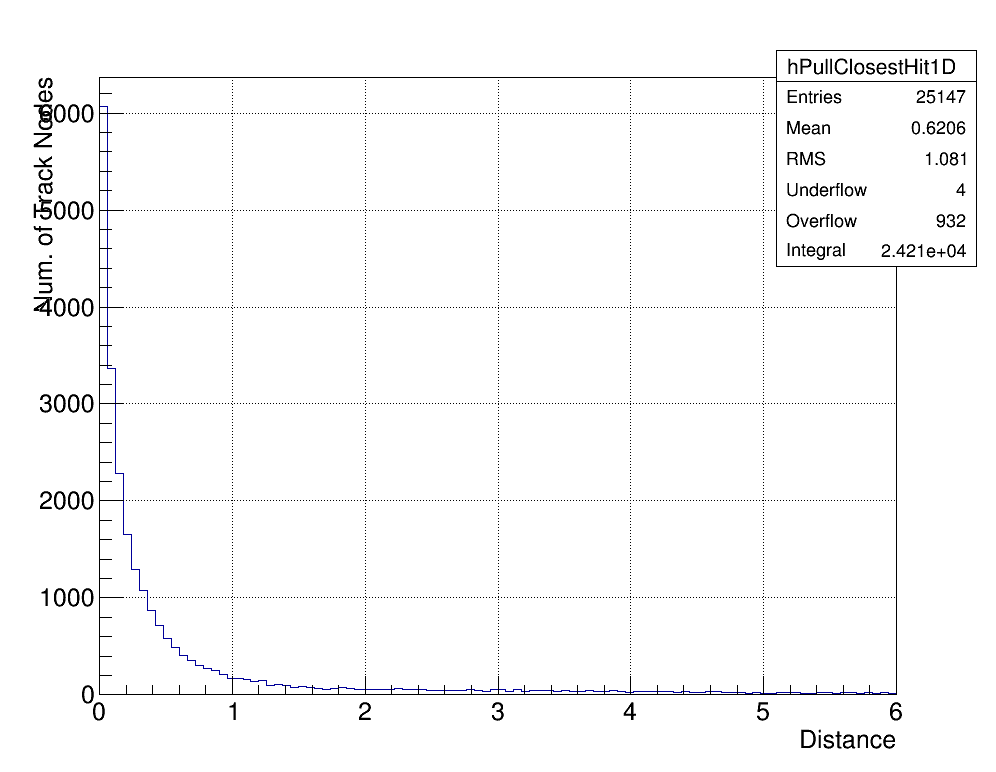
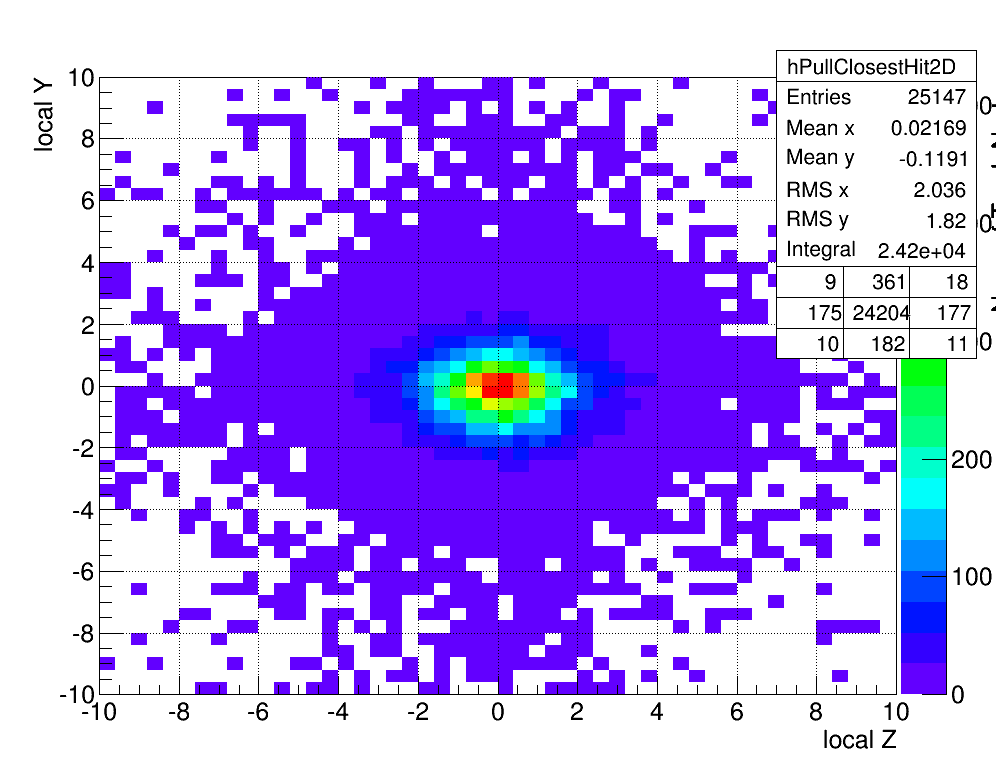
- "Significance" from the mean track projection to the closest hit for IST. The axis values are in "sigma" units
- "Significance" from the mean track projection to the closest (ACCEPTED) hit for IST. The axis values are in "sigma" units
.png)
.png)
- "Significance" from the mean track projection to the closest (REJECTED) hit for IST. The axis values are in "sigma" units
.png)
.png)
- "Significance" from the mean track projection to the ALL hits in 5-sigma window for IST. The statistics is lower because an additional requirement on hits has been placed: The hits are required to belong to the same active Sti volume. The axis values are in "sigma" units
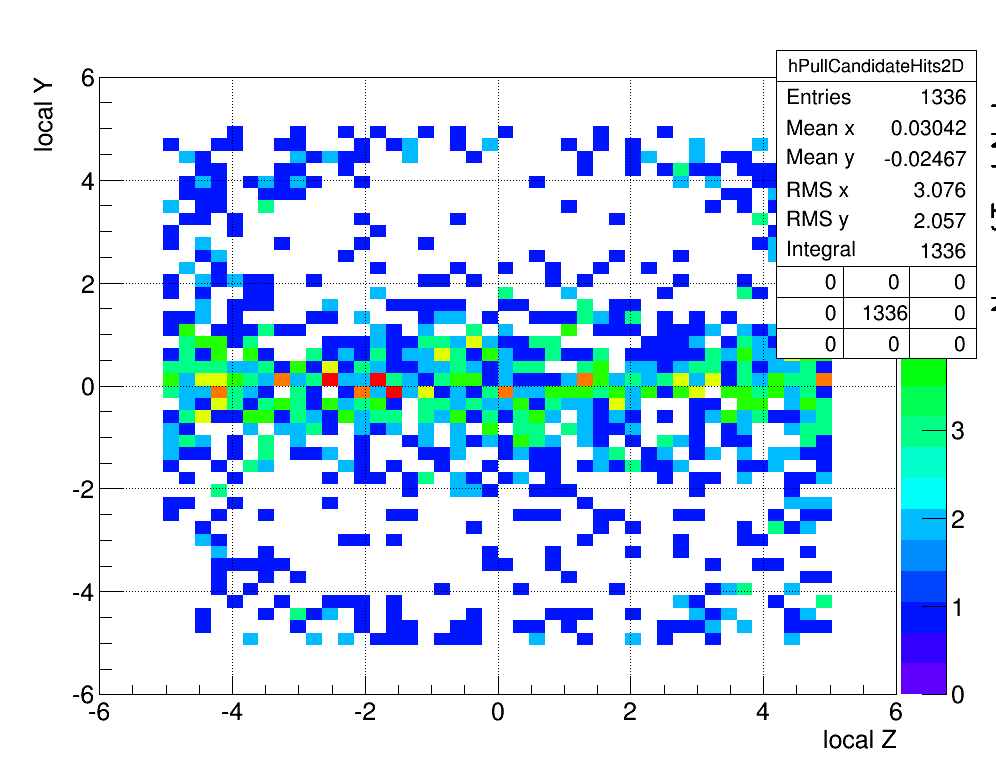
- Hit "efficiency" and support plots. The axis values are in "sigma" centimeters. Should one expect to see edges of sensitive layers in the 2D distributions of mean track position? Does the center of the local Y coordinate start at the normal rather than central vector?
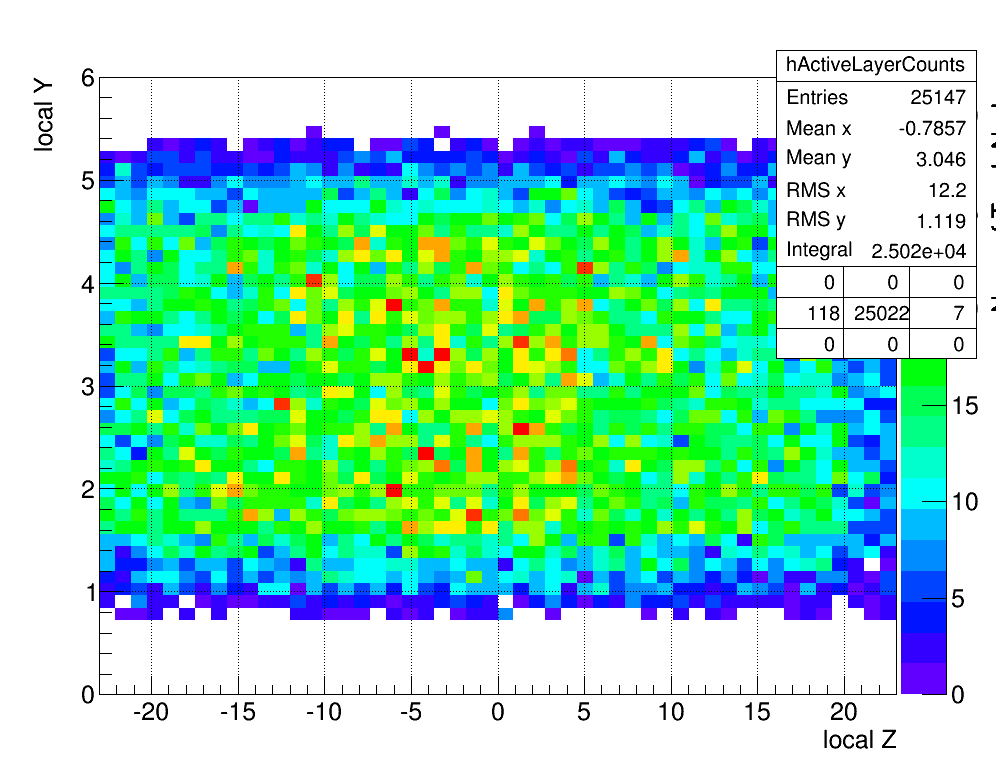
.png)
.png)
»
- smirnovd's blog
- Login or register to post comments