- genevb's home page
- Posts
- 2025
- 2024
- 2023
- 2022
- September (1)
- 2021
- 2020
- 2019
- December (1)
- October (4)
- September (2)
- August (6)
- July (1)
- June (2)
- May (4)
- April (2)
- March (3)
- February (3)
- 2018
- 2017
- December (1)
- October (3)
- September (1)
- August (1)
- July (2)
- June (2)
- April (2)
- March (2)
- February (1)
- 2016
- November (2)
- September (1)
- August (2)
- July (1)
- June (2)
- May (2)
- April (1)
- March (5)
- February (2)
- January (1)
- 2015
- December (1)
- October (1)
- September (2)
- June (1)
- May (2)
- April (2)
- March (3)
- February (1)
- January (3)
- 2014
- December (2)
- October (2)
- September (2)
- August (3)
- July (2)
- June (2)
- May (2)
- April (9)
- March (2)
- February (2)
- January (1)
- 2013
- December (5)
- October (3)
- September (3)
- August (1)
- July (1)
- May (4)
- April (4)
- March (7)
- February (1)
- January (2)
- 2012
- December (2)
- November (6)
- October (2)
- September (3)
- August (7)
- July (2)
- June (1)
- May (3)
- April (1)
- March (2)
- February (1)
- 2011
- November (1)
- October (1)
- September (4)
- August (2)
- July (4)
- June (3)
- May (4)
- April (9)
- March (5)
- February (6)
- January (3)
- 2010
- December (3)
- November (6)
- October (3)
- September (1)
- August (5)
- July (1)
- June (4)
- May (1)
- April (2)
- March (2)
- February (4)
- January (2)
- 2009
- November (1)
- October (2)
- September (6)
- August (4)
- July (4)
- June (3)
- May (5)
- April (5)
- March (3)
- February (1)
- 2008
- 2005
- October (1)
- My blog
- Post new blog entry
- All blogs
Injection runs from Run 19
Updated on Tue, 2019-06-04 15:59. Originally created by genevb on 2019-05-15 16:21.
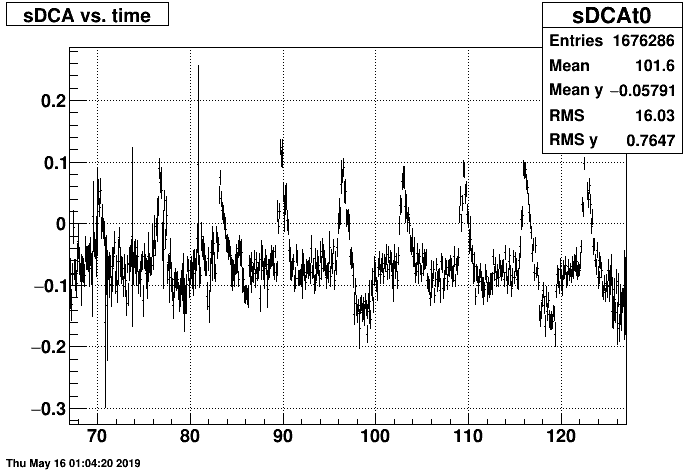
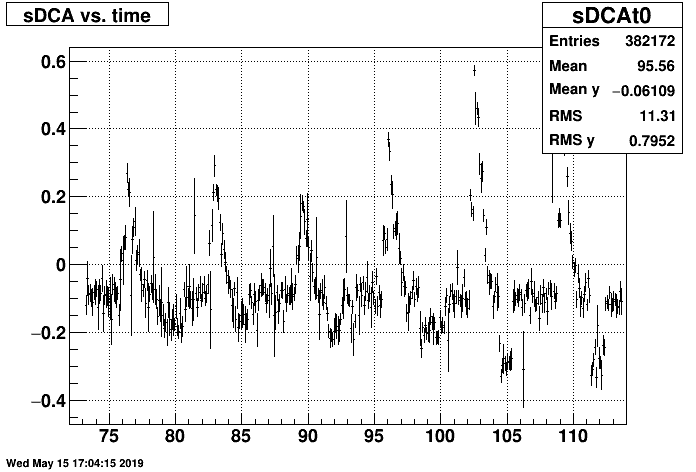
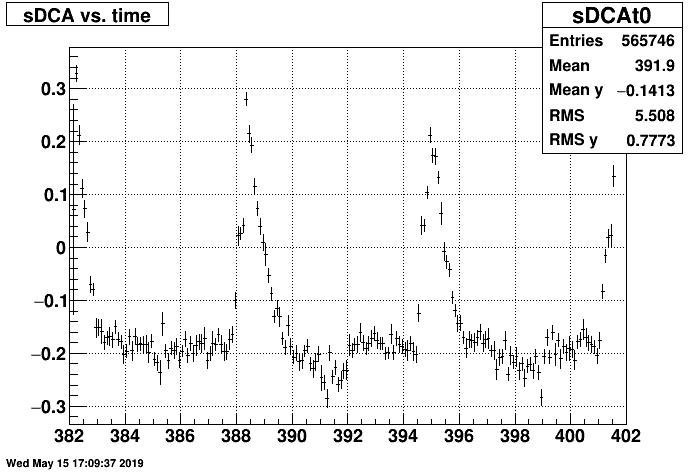
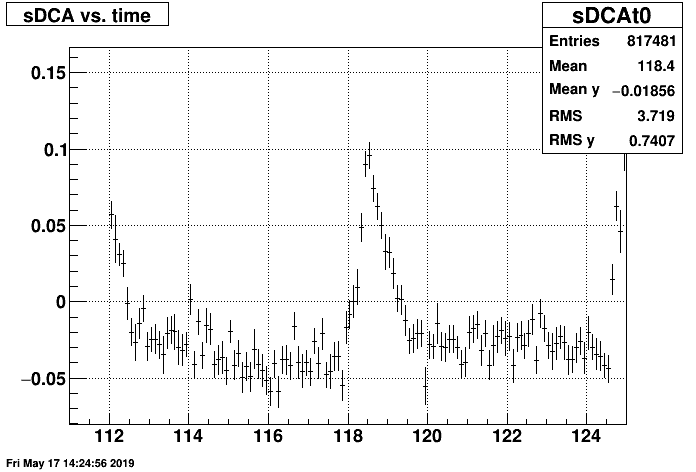
Here's a quick look at sDCA [cm] vs. time [sec] during a few Run 19 injection runs. They demonstrate a large charge deposition in the TPC very similar to what occurred from Abort Gap Cleaning during Run 18 AuAu27 (see this post for some examples), but with a longer delay between charge depositions (now around ~6.7 seconds), and in some cases larger distortions (~0.5 cm base-to-peak) than from the Abort Gap Cleaning.
Run 20114004:
Run 20124002:
Run 20134043:
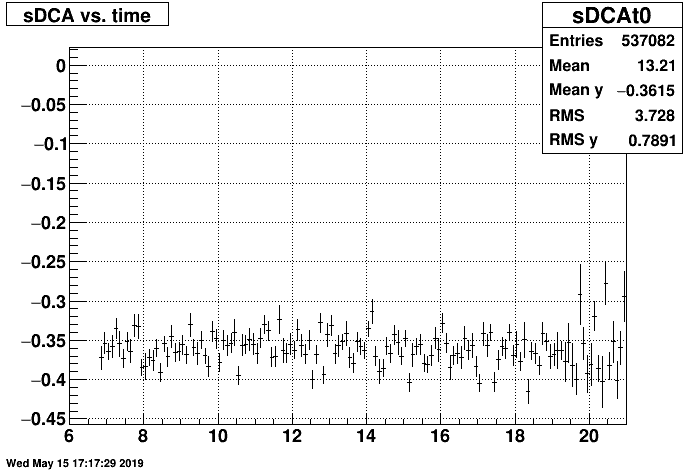
For comparison purposes, here is a non-injection run, which shows that the baseline calibration is off, but the spikes are absent.
Run 20134042:
-Gene
_____________
Update #1 2019-05-17
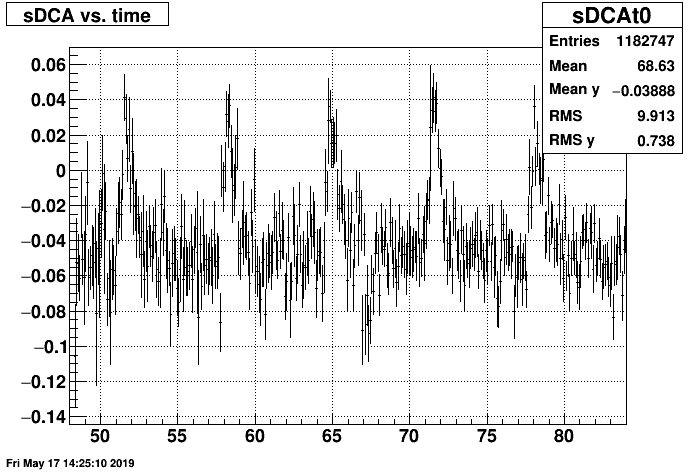
Here are some AuAu19 injection runs, in which the peaks are present but look notably smaller...
Run 20090048:
Run 20092057
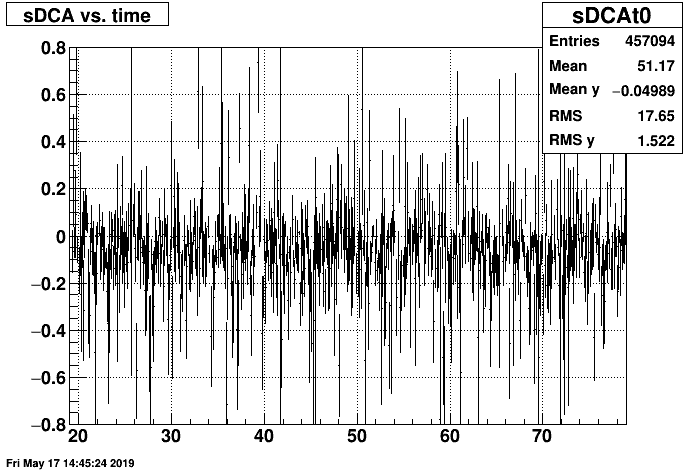
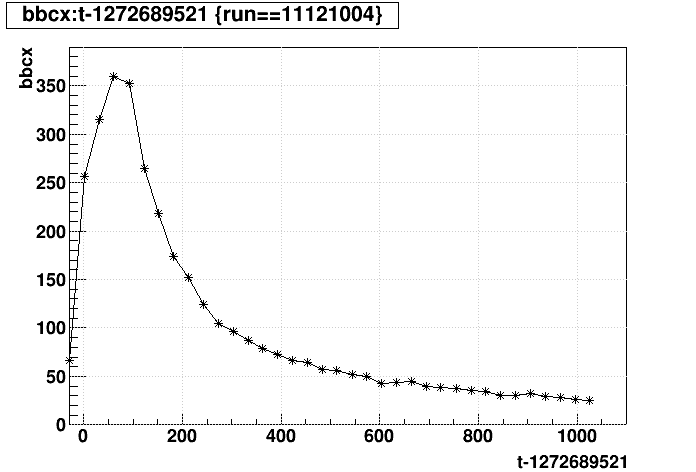
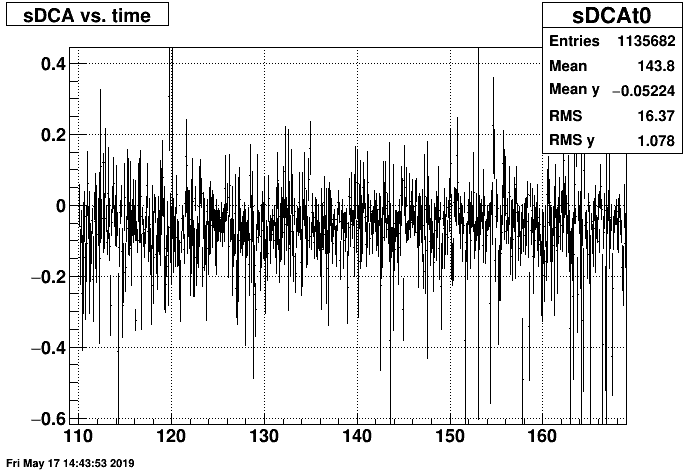
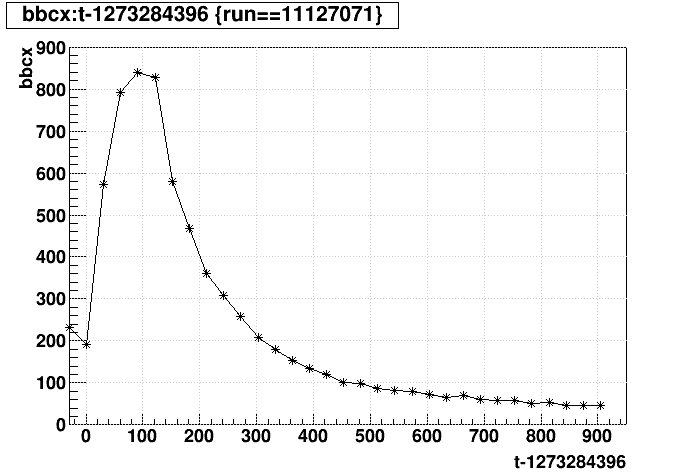
And, as a bonus, we did run during injection during the 7.7 GeV operations in Run 10, so here are DCAs during the first 1 minute of a couple runs from there, along with their BBC coincidence rates vs. time [sec] using the same T0 as in the DCA plots. No notable peaks are observed.
Run 11121004:
Run 11127071
___________
Update #2 2019-06-04
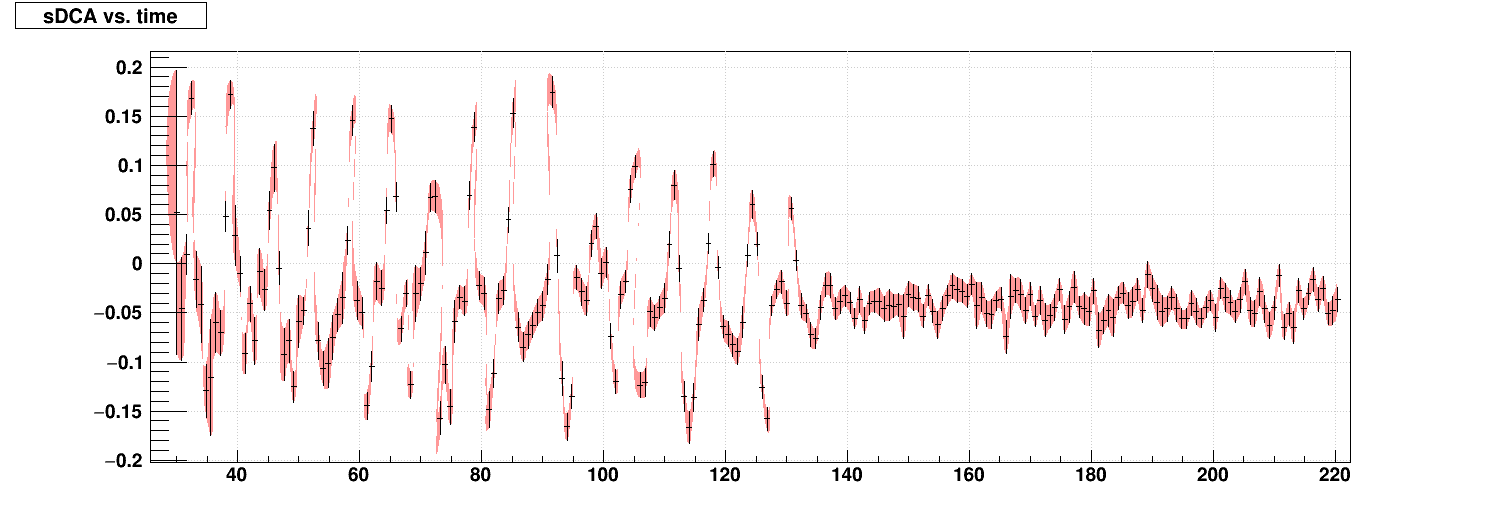
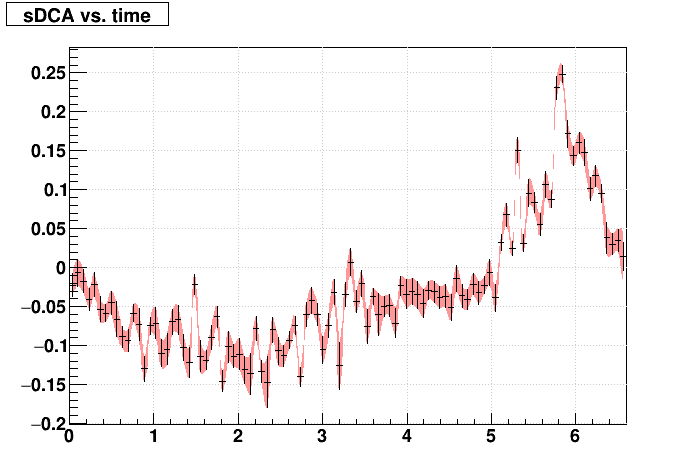
We took a run during AuAu7.7 that spanned injection and after injection, run 20155017. The first three plots are what I see for the BBC coincidence rate [Hz] vs. time-in-run [sec] using the 30-second RICH scalers (from the database), the 1-second RICH scalers (in the DAQ stream), and then a closer zoom of the RICH scalers that helps see what the actual rate is between and after the injection pulses. It's quite clear that the longer integration values of the RICH scalers obscure what is really happening.


Next is the signed DCA [cm] vs. time-in-run, and then the signed DCA using only the first ~2 minutes of the run vs. time modulo 6.6 seconds (or more precisely 6.599 seconds), which appears to be injection cycle periodicity at RHIC. The injection operations clearly produce a periodic distortion of a few mm in the signed DCA, which goes away after injection ceases.
-Gene
Run 20114004:

Run 20124002:

Run 20134043:

For comparison purposes, here is a non-injection run, which shows that the baseline calibration is off, but the spikes are absent.
Run 20134042:

-Gene
_____________
Update #1 2019-05-17
Here are some AuAu19 injection runs, in which the peaks are present but look notably smaller...
Run 20090048:

Run 20092057

And, as a bonus, we did run during injection during the 7.7 GeV operations in Run 10, so here are DCAs during the first 1 minute of a couple runs from there, along with their BBC coincidence rates vs. time [sec] using the same T0 as in the DCA plots. No notable peaks are observed.
Run 11121004:


Run 11127071


___________
Update #2 2019-06-04
We took a run during AuAu7.7 that spanned injection and after injection, run 20155017. The first three plots are what I see for the BBC coincidence rate [Hz] vs. time-in-run [sec] using the 30-second RICH scalers (from the database), the 1-second RICH scalers (in the DAQ stream), and then a closer zoom of the RICH scalers that helps see what the actual rate is between and after the injection pulses. It's quite clear that the longer integration values of the RICH scalers obscure what is really happening.


Next is the signed DCA [cm] vs. time-in-run, and then the signed DCA using only the first ~2 minutes of the run vs. time modulo 6.6 seconds (or more precisely 6.599 seconds), which appears to be injection cycle periodicity at RHIC. The injection operations clearly produce a periodic distortion of a few mm in the signed DCA, which goes away after injection ceases.


-Gene
»
- genevb's blog
- Login or register to post comments
