Simple pi0 Mass Bkg Study
The method for estimating the combinatorial (decorrelated) background is described. The invarient mass distribution is compared for the signal plus all backgrounds and the combinatorial background. After subtracting the background, a few fits of the remaining distribution is considered. These studies are meant to be simple inquiries to guide further study.
Estimate of Combinatorial Background
Every event, the hits are added to a general pool. After adding the hits for a given event, one considers if the pool size is greater than a given size (500 at present). If so, a given (10 at present) number of randomly chosen pairs are generated. Currently, the pairs are required to be in the same sector. If the pool size is greater than the a given maximum size (600 at present), enough hits are removed from the front of the pool to reduce pool size below the maximum value. This mixed events are processed in the same manner as the actual candidate pairs.
Note, however, that a few cuts usually present for the standard candidates are not available, due to the hits not coming from a same event. This is a technical detail, and the invovled cuts may not actually be all that worthwhile anyhow. At present, the following cuts are removed from both the candidates and the uncorrelated pairs:
- Maximum tower ET over all towers in the event (previous cut at 3.0 GeV)
- ET Gaus cut of Weihong
- Two-body cut of Weihong
- Hit ET cut, assuming a vertex position at (0,0,0) (previous cut was at 1.5 GeV)
Thus the cuts left are simply
- Each photon energy > 1.5 GeV
- Vertex in +/- 150 cm
Note: a possible bug involving the photon energy cut is being investigated.
Plots regarding the Combinatorial Background
The following plots were made using a subset of 51 runs, chosen from Weihong's list of runs. The clustering method used was TSP. All other methods/cuts/etc. followed the standard IU procedure, except the cuts noted above. First, the mass distribution for pT in 4-5 Gev (left panel) and pT in 8-9 GeV (right panel) are shown. The combinatorial background distribution has been normalized so that the integral of the two distributions from 0.4 to 0.5 GeV are equal.
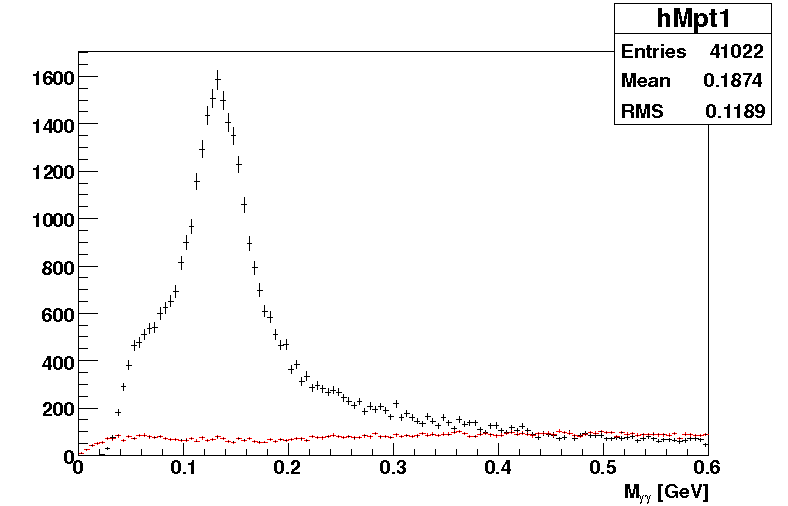
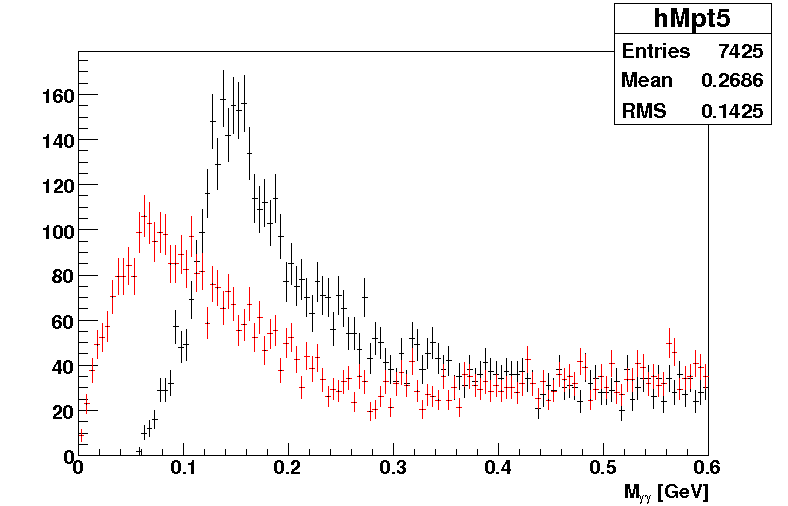
While the plot for the lower pT is resonable, the higher pT is over estimating the combinatorial background at the low mass. Note, though, in both plots the combinatorial background extents to lower invariant mass than the actual candidate pairs. To investigate further, we plot the distribution of the energy asymmetry (Z_gammagamma), opening angle, and energy of the individual photons. Plots for actual candidate pairs are on the left, while anologous plots for uncorrelated photon pairs are on the right.
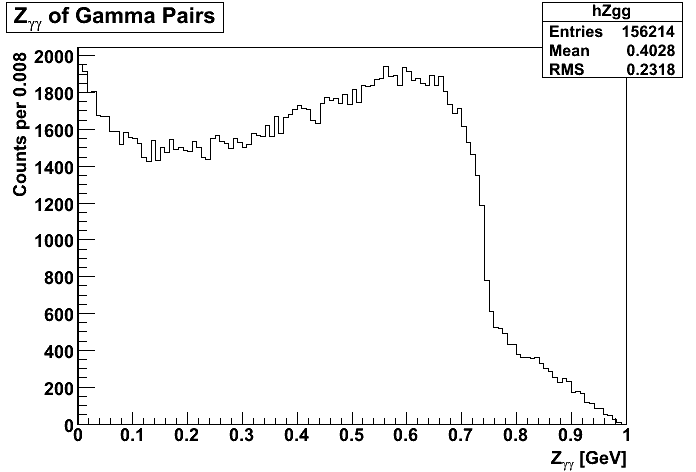
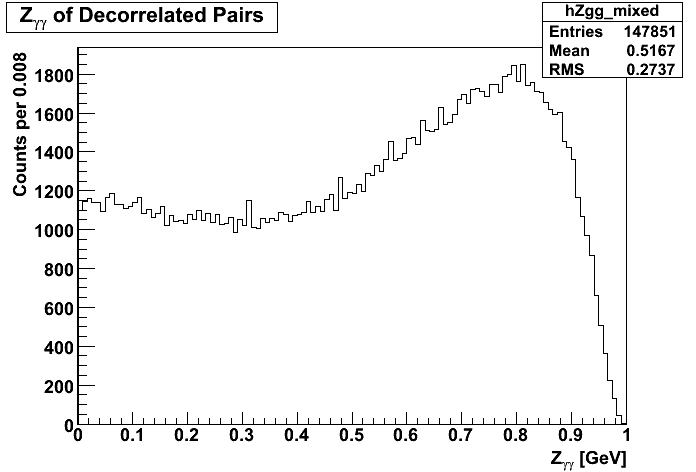
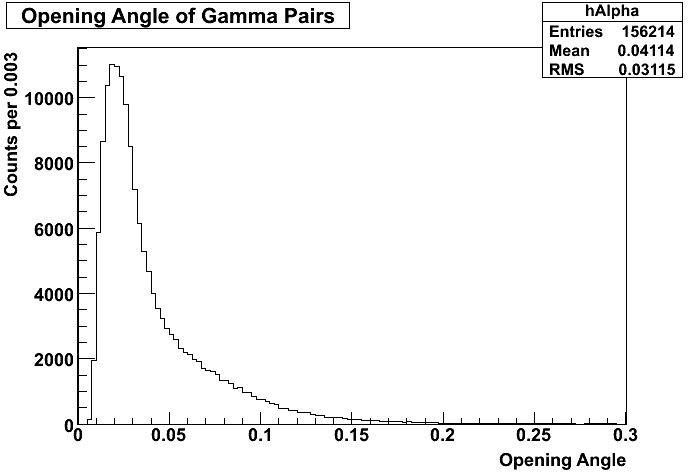
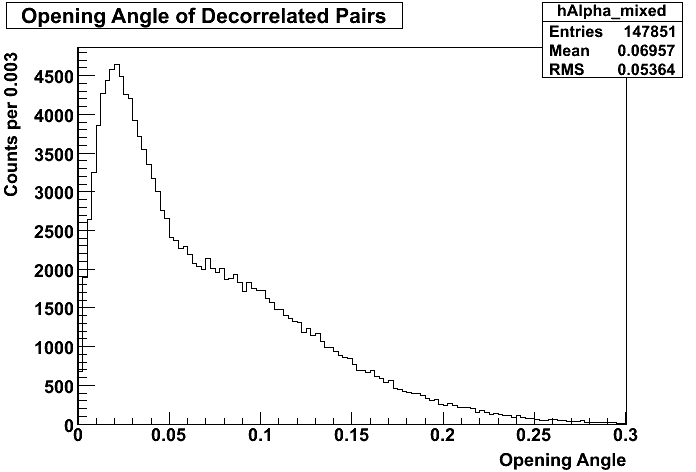
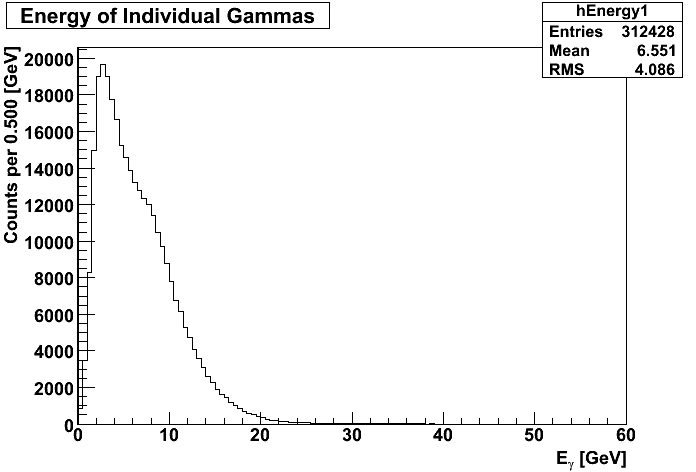
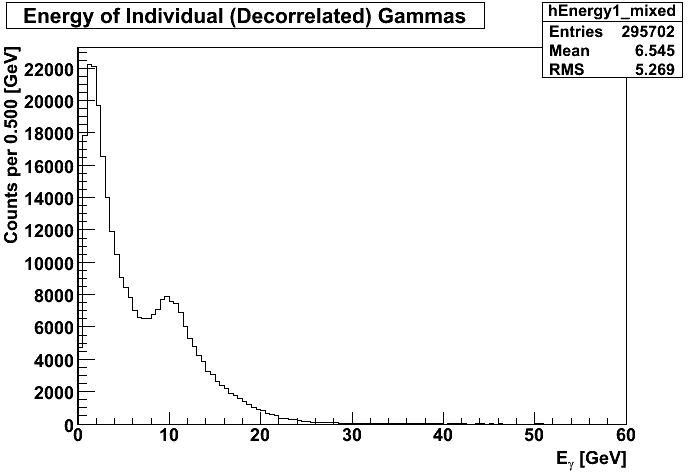
These plots are still being studied, in order to understand the features and the differences.
Fitting the background
The combinatorial background is subtracted from the invariant mass plot, and the result was fit with the following function:
where being the standard, normalized, Gaussian distribution. On the left is the plot for pT in 4-5 GeV and on the right for pT in 8-9 GeV.
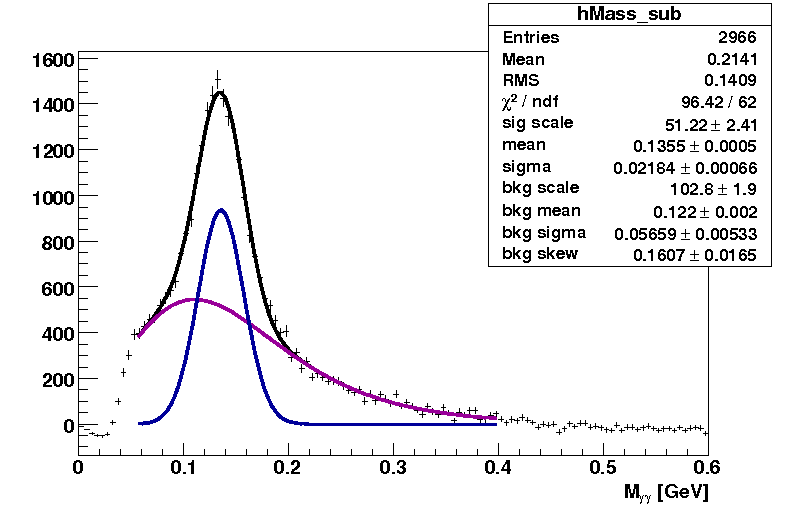
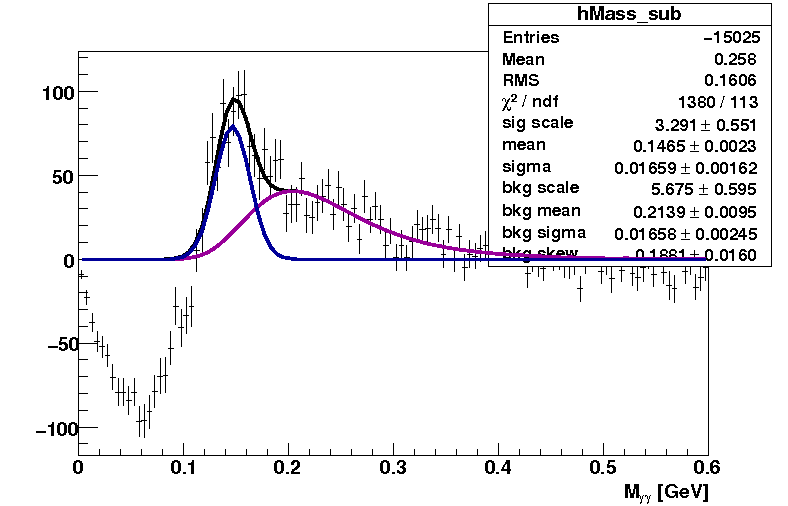
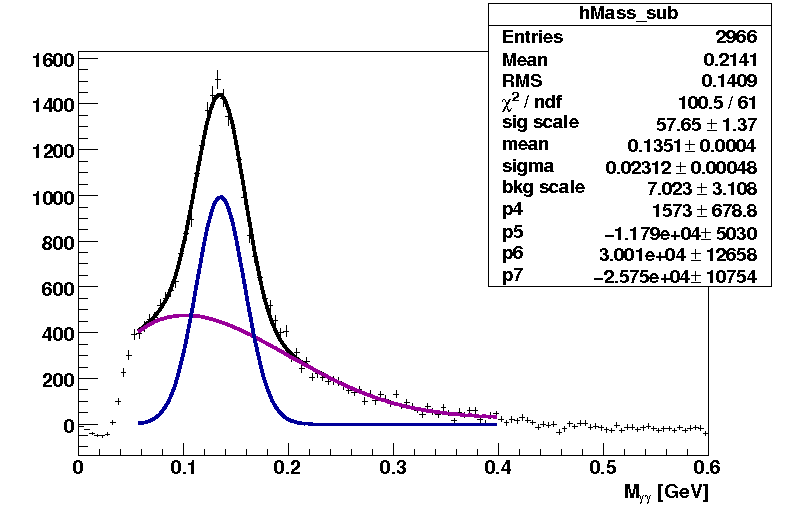
The fit for the lower mass region is reasonable, with a reduced chi^2 around 1.3. The fit in the higher pT region is quite poor, due to the combinatorial background being greatly over estimated. The fits were also made in the other pT regions, with the fits degrading with higher pT. The above two regions that are plotted show either end of the trend with pT. Note, even at the lower pT, the estimated number of pi0s is highly dependant on the fitting shape. For example, the above lower pT fit estimates the number of pi0s to be 9.8k in the mass range 90 to 180 MeV, while using a 4th order polynomial for the background has a reduced chi^2 of 1.6 and an estimates the number of pi0s to be 11.2k in the mass range 85 to 185 MeV. The corresponding plot is shown below. Note, by eye it is diffucult to decide which is the better fit. The main distinguishing is the "peakedness" of the background underneath the pi0 peak.
Conclusions/Outlook
The above study suggests the following further actions and/or questions:
- The cut of 1.5 GeV on the photon energy does not seem to be present in the energy distribution. Find and fix the bug.
- Improve the combinatorial background estimate by adjusting cuts
- Since the combinatorial background is generally fairly flat, could one estimate it better with a function rather than the above estimate?
- Use Monte Carlo tdata to better determine the shape of the background due to conversions and split clusters.
- Could the fitting be improved by looking at smaller pT regions?
- sgliske's blog
- Login or register to post comments
