- heppel's home page
- Posts
- 2021
- July (3)
- 2020
- February (1)
- 2019
- 2018
- 2017
- 2016
- December (2)
- November (2)
- October (3)
- September (2)
- August (1)
- July (3)
- June (5)
- May (8)
- April (4)
- March (1)
- February (2)
- January (2)
- 2015
- December (1)
- November (4)
- October (8)
- September (4)
- August (3)
- July (2)
- June (7)
- May (8)
- April (5)
- March (13)
- February (5)
- January (2)
- 2014
- December (1)
- November (2)
- September (1)
- June (3)
- May (2)
- April (1)
- March (3)
- February (2)
- January (1)
- 2013
- 2012
- 2011
- December (2)
- November (1)
- September (2)
- August (3)
- July (2)
- June (6)
- May (2)
- April (2)
- March (3)
- February (3)
- January (3)
- 2010
- December (1)
- November (2)
- September (2)
- August (1)
- July (4)
- June (3)
- May (2)
- April (1)
- March (1)
- February (2)
- January (1)
- 2009
- 2008
- My blog
- Post new blog entry
- All blogs
Further analysis from Len's trigger spreadsheet for run 10124075
Hi
This is an look at further analysis of Len's spreadsheet file for Run 10124075 with a follow up on gain matching of run 10124072.
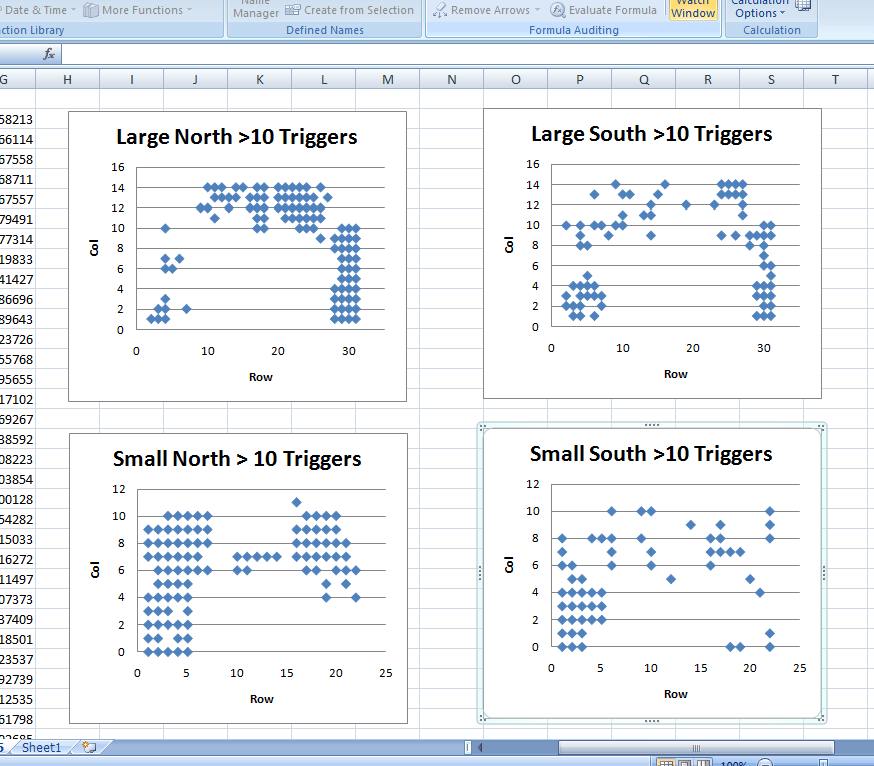
Len's analysis shows analyses of some events from run 10124075 and identifies about 120,000 times that the FMS trigger was satisfied.
Row and col bins are incremented if the trigger was satisfied more than 10 times
This comes from my copy of Len's spreadsheet file, saved here.

Also, for run 10124072, gain matching continues.
The following figure shows
- Upper Left Pi peak from gain matching small cells (looks ok)
- Upper Right Pi peak from gain matching large cells (does not look good yet)
- Lower Left distribution of events with >5 cnts in the ADC from Small Cells
- Lower Right distribution of events with >5 cnts in the ADC from Large Cells
.gif)
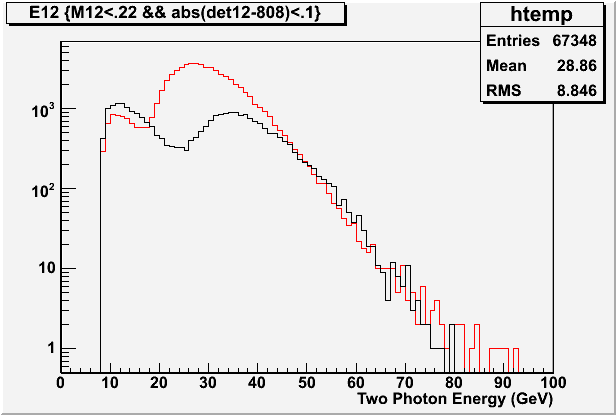
Gain Matching Continues: Current (and changing) Small Cell Energy Distribution for North and South FMS (Run 10124072)
Red is for North Small FMS and Black is for South Small FMS. Energies from large cells do not yet make much sense.

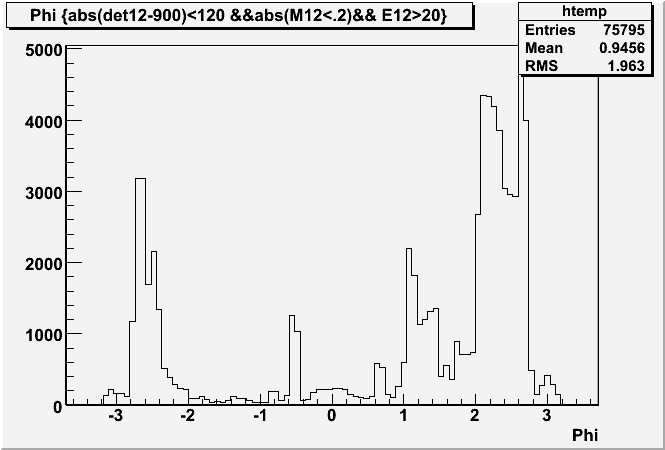
Finally for small detectors, this is the Phi distribution of reconstructed pi0's with E>20 Gev

More analysis of Lens Spreadsheet
STAR/files/userfiles/1651/file/20090509/20090509_fromLes_fromSteve.xls
- heppel's blog
- Login or register to post comments
