- jwebb's home page
- Posts
- 2019
- 2018
- 2017
- 2016
- 2015
- 2014
- 2013
- November (1)
- October (1)
- September (1)
- July (1)
- June (1)
- April (1)
- March (3)
- February (1)
- January (1)
- 2012
- 2011
- December (2)
- September (3)
- August (5)
- July (6)
- June (6)
- May (1)
- April (5)
- March (5)
- February (2)
- January (2)
- 2010
- December (3)
- October (3)
- September (2)
- August (2)
- June (2)
- May (4)
- April (4)
- March (2)
- February (4)
- January (10)
- 2009
- 2008
- 2007
- 2006
- July (1)
- My blog
- Post new blog entry
- All blogs
Improving the Isolation Cut, part II
Updated on Sat, 2008-07-26 11:23. Originally created by jwebb on 2008-07-25 10:44.
.png)
.png)
.png)


Abstract: Improving the Isolation Cut I studied the impact of cluster size on isolation cuts using fairly simple MC events. It appears from this study that using 1-tower clusters w/ a correction factor for energy leakage is a promising way to improve pi0 rejection while keeping gamma efficiency high. In this blog entry I will try to further refine the simple model which I employed
in the original study.
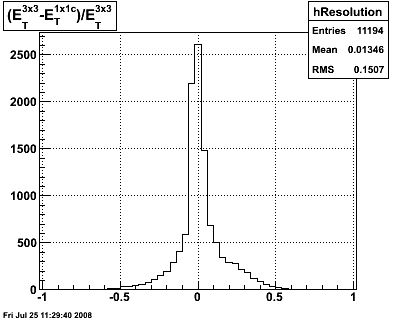
Figure 1 -- pT resolution for 1-tower cluster w/ energy leakage correction.
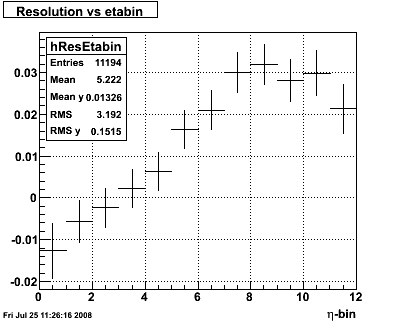
Figure 2 -- Resolution vs etabin.
Observations:
1. Looks like there is a bug in the geometry classes (?) in sector 12 which is producing a significant shift...
2. There appears to be both an eta dependence and a subsector dependence to the reconstruction.
The problem in sector 12 looks like a bug in the slow simulator which was solved a few months ago... looks like the DEV library
hasn't been rebuilt at pdsf for a while.
I'll put off bug-hunting for a little while and simply cut out sector 12. (Also need to rule out a link between sector 12 and deviation at large etabin).
Figure 3 -- Resolution vs etabin, with sector 12 cut out.
Resolution vs etabin has the same behavior w/ and w/out sector 12. So there isn't a link between the 2% shift at large etabin and the ~15% shift in sector 12.
We can fit and remove the etabin dependence fairly easily.... resolution vs etabin is now flat to w/in 0.5%.
Figure 4 shows isolation ratio and background vs rejection after the broad eta dependence in figure 3 has been removed from the data.
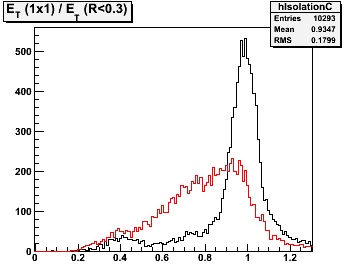
Figure 4 -- Ratio of 1 tower cluster ET (corrected) to ET summed over R<0.3. Black histogram is single MC gammas. Red histogram is single MC pion decays. Resulting rejection-vs-efficiency curve is shown at left in red, compared w/ curve for an uncorrected 1-tower cluster in black.
![]()
.png)
Clearly we want to make the single gamma peak as narrow as possible in the above plot. So let's look for places where the photon resolution is degraded to try to tighten it up. How far can we go here?
- note: there are ~250 events in the overflow bin above.
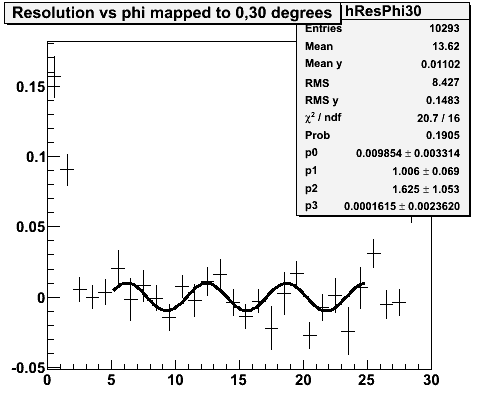
Figure 5 -- After correcting out the broad eta dependence, plot the resolution vs phi mapped within the 30 degree sectors.
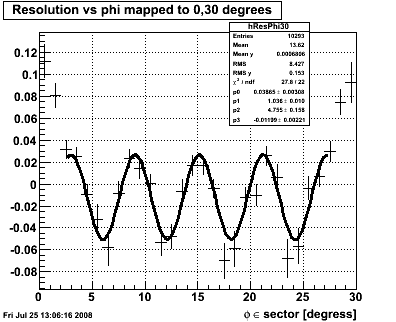
There are two effects in this plot. At sector boundaries we tend to get the cluster position wrong, favoring something closer to the center of the tower. Thus we make a smaller correction than we should. The sinusoidal pattern which peaks at the center of each tower indicates that we have ... too little leakage in our toy model. We undercorrect near the center of the towers and we overcorrect near the edges.
The simplest test to make is to cut out subsectors A & E. If we get improvement (and I expect this to be the case) then we'll make a correction to the shower shape.
Figure 6 -- Isolation ratio and rejection-vs-efficiency for events w/out subsectors A&E.
Definite improvement... up to ~65% @ 80% where previously it was ~60% @ 80%.
07/26/2008
Next we try to take out some some of the model dependence in the energy correction. We start w/ the oscillatory behavior vs phi seen in figure 5.
Figure 7 -- Resolution vs phi after correction for the observed phi dependence
Figure 8 -- Edge correction. The fit is to a normalized gaussian with a fixed mean at phi = 0 degrees. (phi wraps around in this plot).
Note that this suggests that w/in 2 degrees of a sector boundary one is experiencing a distortion of the SMD reconstruction.
There has been no attempt to sort by sector type here.
Figure 9 -- isolation ratio and eff vs rej after correcting out the resolution effects in phi.
This has not produced any obvious improvements... in fact, the overall resolution has deteriorated relative to figure 4. Correcting the tower energy near sector boundaries is not going to be effective, unless we figure out how to get the SMD's to span across them.
»
- jwebb's blog
- Login or register to post comments