Conversion Rates for Gammas Identified in pi0 Decays and Isolated w/in a Single Tower
Updated on Tue, 2008-06-10 17:35. Originally created by jwebb on 2008-06-09 12:50.
.png)
.png)
.png)

Abstract: Background conversion probability using identified pi0 sample, take 2 we have used identified pi0 and eta decays to estimate background conversion rates. It is important to cross check that the conversion rate for a single photon, isolated in a single calorimeter cell, agrees with the conversion rate expected based on the thickness of the radiator. This was shown to work well for single photons isolated from eta decays, and for the pair of photons identified in both eta and pi0 decays. However, when we examine the conversion rate for single photons isolated in a tower from a pi0 decay, the conversion rate does not agree with the 1-photon hypothesis. In this study, we show that the background beneath the pi0 peak does not explain this discrepancy.
0.0 Data Sample and Cuts
Data sample:
274 runs from ppLong2 (no QA cuts)
Select EEmc L2gamma triggers
π0 finding:
mEEclusters->setSmdSeedEnergy( 3.0, 0.0 ); // seed and slope [MeV]

mEEclusters->setSmdMaximumSize(4);

mEEclusters->setSmdMinimumStrips(5);

mEEclusters->setSeedEnergy(2.0);

mEEclusters->setMinimumEnergy(0.5);

mEEpoints=new StMyPointMaker("mEEpoints",mEEanalysis,mEEclusters);

mEEpoints->setSplit();

mEEpoints->setSplitMinimumET(6.5);
Cuts:
0) Reconstruct a π0 candidate
1) Isolation cut -- ET(π0) / ET(0.3) > 0.9
n.b. isolation cut does not include BEMC towers (this is a change from previous analysis)
2) CPV cut, Epre1 == 0 w/in cone = 0.3
3) Analyzer, tower containing the gamma candidate
n.b. CPV cut does not include BPRS (this is the same as previous analysis).
1.0 Fits to the Invariant Mass Spectra
We first bin the data into three bins in pseudorapidity. A background estimate is performed by fitting the events which satisfy the CPV cut to an exponential plus a gaussian.
Figure 1 -- Invariant mass spectra for events which pass the isolation and CPV cuts above. Fit is an expo+gaus, and is used to estimate signal to background. Magenta lines represent the errors on the exponential fit (worst case).
Note: We know from other studies that the high mass tail of the pi0 peak contains real pi0 decays whose mass has been affected by (a) cluster merging at high pT, and (b) contribution to the energy of the pi0 candidate from the surrounding jet. The tail also has contributions from jet combinatorics. So this procedure is likely to underestimate
the s/b ratio somewhat.
Note: w_{signal} is the estimated fraction of events w/in 0.1 < M < 0.2 GeV. Averaging the three eta bins I get something like
s/b = 4.5 +/- 1.5 and w = 0.82 +/- 0.05
2.0 Determine Conversion Rates for pi0 "signal" Region and Background Region
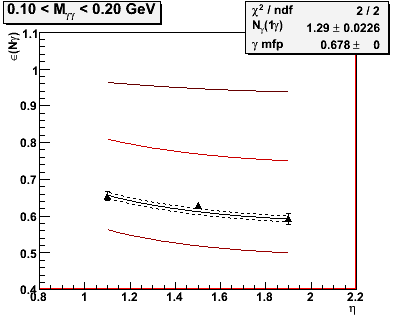
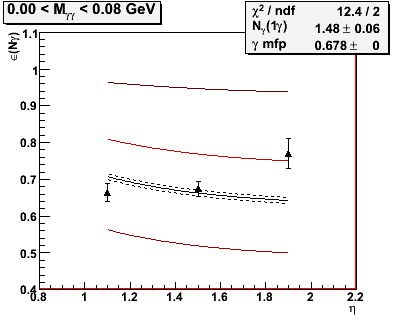
Next plot the conversion rate versus eta for two regions. The pi0 signal region, with 0.1 < M < 0.2 GeV, and the background region with 0 < M < 0.08. We then fit these to the expected conversion rate versus eta for the known material in the absorber.
Figure 2 -- 1st-radiator conversion rates measured for single photon from pi0 decay isolated w/in one tower. Left plot shows events from pi0 signal region. Right from the low mass background region.
Observations:
1. Conversion rate is too high for single photons taken from pi0 sample.
2. Conversion rate is even higher in the low mass background region
3.0 Correction to Nγ based on observed background conversion rates
(N from pi0) * (fraction of pi0's) + (N from low mass background) * (fraction of low mass background) = 1.29
fraction of pi0's = 4.5 / 5.5
fraction of low mass background = 1.0 / 5.5
Therefore (N from pi0) = 1.25
More formally we have:
Nmeasured = Nsignal × wsignal + Nbg × wbg, or
Nsignal = ( Nmeasured - Nbg × wbg) / ( 1 - wbg )
which looks familar somehow... so easy to propagate uncertainties.
We find
N = 1.25 +/- 0.03 photons / tower.
The correction from the background under the pi0 peak is insufficient to explain the discrepancy.
4.0 Ngamma fit in the High Mass Tail 0.22 < M < 0.38
Figure 4 -- Conversion rate for single gammas isolated in a single tower from the combinatoric background region of the pi0 invariant mass.
1. Conversion rate is consistent w/ more than one photon per event.
2. Conversion rate is consistent w/ rate observed in the pi0 mass region (once low mass BG accounted for).
»
- jwebb's blog
- Login or register to post comments