Background conversion probability using identified pi0 sample, take 2
Updated on Mon, 2008-06-09 10:23. Originally created by jwebb on 2008-05-12 16:01.


Abstract: A sample of identified π0 decays Background conversion probability using identified pi0 sample to measure the conversion rates for background events and/or estimate the mean number of photons detected by the preshower system within various radii of the π0 candidate. In this note we
- Estimate the mean number of photons detected by the preshower system w/in four isolation regions around the reconstructed π0,
- Estimate the mean number of photons incident on the tower(s) containing the two photons in the reconstructed π0, and
- Estimate the mean number of photons incident on the tower containing the leading photon in the reconstructed π0.
Contents:
0.0 Data Sample and Cuts
Data sample:
274 runs from ppLong2 (no QA cuts)
Select EEmc L2gamma triggers
π0 finding:
mEEclusters->setSmdSeedEnergy( 3.0, 0.0 ); // seed and slope [MeV]

mEEclusters->setSmdMaximumSize(4);

mEEclusters->setSmdMinimumStrips(5);

mEEclusters->setSeedEnergy(2.0);

mEEclusters->setMinimumEnergy(0.5);

mEEpoints=new StMyPointMaker("mEEpoints",mEEanalysis,mEEclusters);

mEEpoints->setSplit();

mEEpoints->setSplitMinimumET(6.5);
Cuts:
0) Reconstruct a π0 candidate
1) Isolation cut -- ET(π0) / ET(0.3) > 0.9
n.b. isolation cut does not include BEMC towers (this is a change from previous analysis)
2) CPV cut (various)
3) Analyzer (various)
n.b. CPV cut does not include BPRS (this is the same as previous analysis).
For section 1.0 the CPV and analyzer cuts are varied over three cone radii and one cluster size. For sections 2.0 and 3.0, we revert to the R<0.3 condition for the CPV cut. But in sections 2.0 and 3.0, the analyzer is restricted to the tower or towers containing the photon(s) of interest.
1.0 Estimated Number of Photons w/in 4 Isolation Cuts
The analysis follows what was done Background conversion probability using identified pi0 sample. We reconstruct p0 decays, and bin in mass and pseudorapidity. We then count the number of pi0 decays which satisfy the CPV cut (Epre1==0), and the number which satisfy the analyzing cut (Epre2>0), within a given radius of the leading gamma. Here we allow the radius to vary, starting with the 3x3 tower patch and ending with R<0.7. In what follows, we assume that the observed conversion rate can be calculated simply as the probability for a single photon to pair-convert w/in the 1st radiator. Thus,
εγ = 1.0 - e-0.6873 / cos(θ),
where the factor 0.6873 is calculated as 7/9 (x/X0), for the Pb and stainless steel which comprise most of the material in the first radiator (we neglect plastic, epoxy, etc...).
For N gammas incident on the endcap, we expect to see a conversion rate εbg given by an expression
(1.0 - εbg) = (1.0 - εγ)N.
Since we don't know N a priori, we will use the above expression to fit the number of photons rather than to determine the
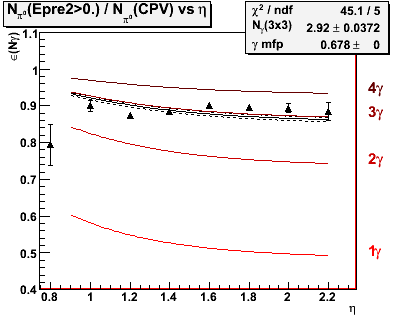
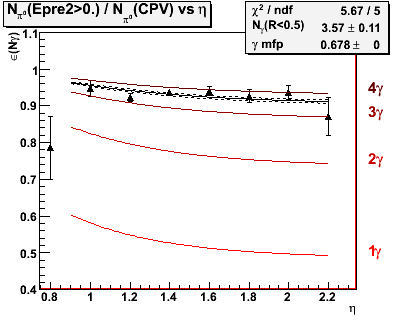
Figure 1.1 -- Fit to the number of gammas w/in an isolation cut. At left, number of gammas in a 3x3 patch of towers centered on the leading gamma in the identified pi0 decay. At right, R<0.3. The red curves show the expected conversion rate versus pseuedorapidity for 1, 2, 3 and 4 photons based on the thickness of the 1st radiator. The fit is a one parameter fit to the number of photons.
Figure 1.2 -- Fit to the number of gammas w/in an isolation cut. At left, number of gammas in aR<0.5 centered on the leading gamma in the identified pi0 decay. At right, R<0.7. The red curves show the expected conversion rate versus pseuedorapidity for 1, 2, 3 and 4 photons based on the thickness of the 1st radiator. The fit is a one parameter fit to the number of photons.
Observations:
1. The mean number of photons rises as we increase the isolation cut, starting with 2.92 in the 3x3 patch of towers and growing to 3.5 w/in R<0.5 and R<0.7.
2. Therefore on average we expect (2.92-2)/9 = 0.1 "extra" photons in each tower per event.
3. The fit chi^2 are not particularly good for either the 3x3 tower patch or the R<0.3 isolation cone. There is an apparent dip at about eta=1.2 or so.
4. There is a systematic trend in all 4 isolation zones. Events at smaller eta show up with a systematically smaller conversion rate than the curve suggests. Events at larger eta show up with a conversion rate higher than the curve suggests.
2.0 Occupancy of the Tower(s) Containing the Photons Identified in the Decay
For the next set of plots, the CPV is applied over all preshower1 tiles w/in R<0.3 of the leading photon candidate. However, we restrict the analyzing cut (Epre2>0) to sum over the tower or towers which contain the two photons identified in the pi0 decay. In other words, we are testing to see whether the conversion rate observed in the preshower layers above the two photons is consistent with the conversion rate expected for two photons.
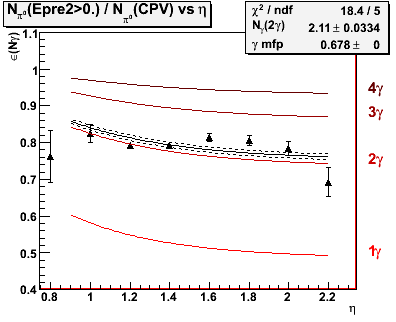
Figure 2.1 -- Observed conversion rate in the 2nd preshower layer for the tower or towers containing the photons from the reconstructed pi0 decay.
Observations:
1. The fit suggests 2.11 +/- 0.03 photons are contained within the two towers.
2. Correcting for the "extra" photons identified in figure 1.1, we would subtract off 0.10 +/- 0.04 photons per event. This suggests that we have 2.01 +/- 0.05 photons per event. Consistent with our expectations.
3. We still see the small eta --> low conversion rate, high eta --> high conversion rate (relative to the curve) evidenced above.
3.0 Occupancy of the Tower Containing the Leading Photon in the Decay
Next we restrict the analyzing cut to the tower containg the leading photon, and only the leading photon, in the pi0 decay. The goal here is to test whether the conversion rate is consistent with a sinlge photon.
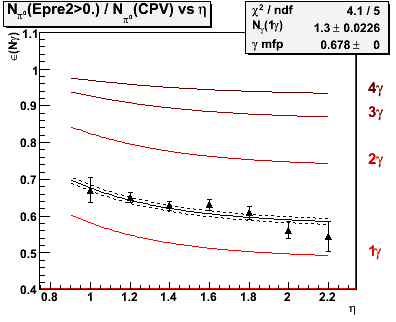
Figure 3.1 -- Observed conversion rate in the 2nd preshower layer for the tower containing the leading photon, and only the leading photon, in the pi0 decay.
Observations:
1. The fit is particularly good here. The trend observed previously -- low eta under the curve, high eta above the curve -- is not in evidence.
2. The fit suggests that there are 1.30 +/- 0.02. Correcting for the "extra" photons, we would have 1.20 +/- 0.04. The observed conversion rate is higher than predicted by the amount of material in the first absorber. (Uncertainty in the material is shown by the dashed lines in the fit).
3. The observed conversion rate is higher than expected for a single photon, which seems inconsitent with the conclusions above for the two photons in the pi0 decay.
We can repeat this exercise with the eta --> 2 gamma decays, although here we need to integrate over all pseudorapidity to get enough statistics. We get the following:
N(CPV) = 127
N(Epre2>0) = 68 for leading gamma isolated w/in a single tower
==> May have enough statistics to slice into eta bins (see below) <==
This results in epsilon = 0.55 +/- 0.02, at a mean pseudorapidity of 1.54. This is in much better agreement with what we expect for a single isolated photon, and in better agreement with what is observed in "Will's" and "Pibero's" eta-derived photon candidates.
4.0 Comparison between "pi0 photons" and "eta photons"
In the following, we have restricted the fit range to 1.1 < eta < 1.9. Beyond this, the statistics are getting pretty crummy, and our assumption of gaussian statistics breaks down.
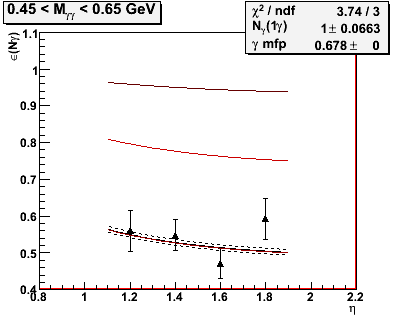
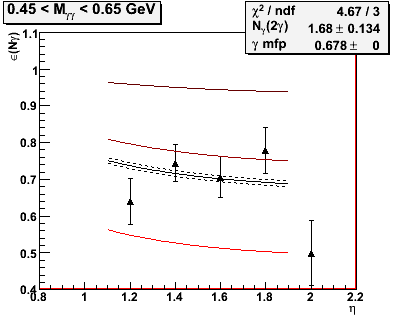
Figure 4.1 -- Fit conversion rate using the leading photon from a reconstructed eta, where the photon is isolated w/in a single tower. Fit is consistent w/ 1 gamma.
Figure 4.2 -- it conversion rate using the two photons from a reconstructed eta. The photons are allowed to occupy either one or two towers.
Observations:
1. The conversion rate for the leading photon isolated w/in a single tower is consistent w/ our expectations, as has been previously observed for Will's and Pibero's photon sample.
2. For the two photon case, we are slightly more than 2 sigma away from the expectation.
5.0 Additional Notes
1) Tried adding a zgg cut, with zgg>0.4, to further separate the two photons in the pi0 decay. The results for both the eta and pi0 remained the same. Etas are in agreement w/ expectations, pi0's are in agreement when looking at the two towers containing the pi0 decay, but the single tower isolation "fails"... on average, it appears that the second photon is contributing signal w/in the tower. Next try a cut on the seed-to-cluster energy ratio.
»
- jwebb's blog
- Login or register to post comments