- seelej's home page
- Posts
- 2011
- 2010
- December (2)
- November (3)
- October (3)
- September (3)
- June (2)
- May (3)
- April (2)
- February (9)
- January (1)
- 2009
- December (1)
- October (3)
- September (4)
- August (1)
- July (1)
- June (6)
- May (1)
- April (4)
- March (5)
- February (1)
- January (4)
- 2008
- My blog
- Post new blog entry
- All blogs
Correlations in BSMD Saturation in run9
Updated on Mon, 2009-03-30 14:37. Originally created by seelej on 2009-03-30 14:37.
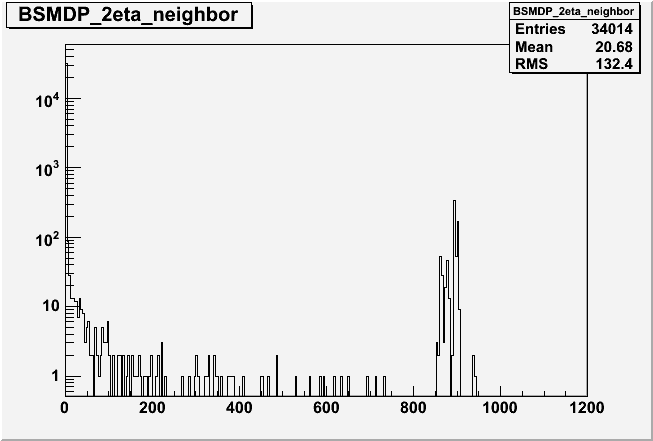
As part of the QA that I've been doing for the run9 data I began to look at saturation in the BSMD. What I did was take any strip that had an adc value >= 850 and then look "around" that strip (in each plane separately) to see how many other strips were also saturated. There is a pdf attached that has a number of plots in it. They are labeled BSMD{E,P}_{1,2,3}{eta,phi}_neighbor. The name of the plot refers to which plane had the offending strip (BSMDE or BSMDP), which neighboring strip in that plane (1 away (next to), 2 away, 3 away) and in which direction the spectrum is looking (eta or phi). So for example BSMDE_2phi_neighbor is the spectrum of strips around a hot strip in the BSMD eta plane where I looked 2 strips away in the phi direction. The plots are adc spectra for each of these distributions. Most of them look normal. The BSMDE_{1,2,3}eta_neighbor and BSMDP_{1,2,3}phi_neighbor plots show strong correlation with saturation in neighboring strips whereas for the most part the BSMDE_{1,2,3}phi_neighbor and BSMDP_{1,2,3}eta_neighbor strips show weak correlation except for one case, the BSMDP_2eta_neighbor plot which shows a rather strong correlation. See this plot below
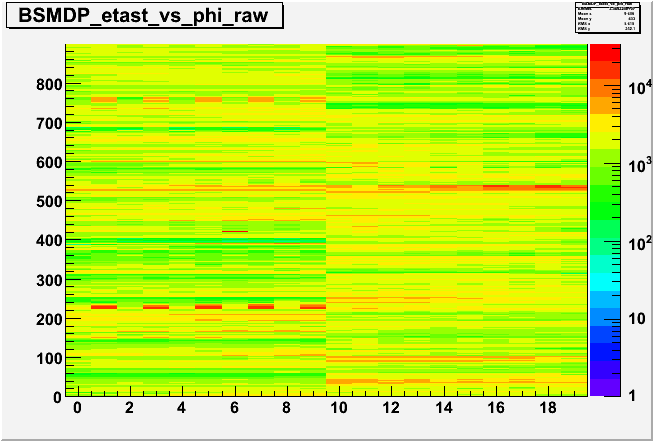
This is most likely caused by some serious cross talk in the channels which you can see from the raw 2d spectra below of the BSMDP phi plane (x vs y = eta strip # vs phi strip #) where you can see strong correlations in the eta direction in this phi plane (a periodic behavior).
»
- seelej's blog
- Login or register to post comments